Download
1 / 18
180 likes | 314 Views
Ozone Trends Across the United States over a Period of Decreasing NOx Emissions. Heather Simon, Adam Reff, Benjamin Wells, Neil Frank Office of Air Quality Planning and Standards, US EPA. Importance of Ozone Distribution.

E N D
Ozone Trends Across the United States over a Period of Decreasing NOx Emissions Heather Simon, Adam Reff, Benjamin Wells, Neil Frank Office of Air Quality Planning and Standards, US EPA
Importance of Ozone Distribution • Ozone is an important atmospheric oxidant: changes in spatial and temporal ozone patterns affect NOx cycling and secondary aerosol formation • Changing spatial and temporal patterns will affect overall ozone exposure to individuals and populations • Ozone damage to plants is most reflective of cumulative rather than peak ozone exposure • Changing spatial patterns affect how areas will implement controls to meet air quality goals
Motivation: Chicago Case Study • Past Modeling analysis has predicted future NOx reductions will lead to changes in spatial and temporal patterns of ozone • Increasing nighttime and decreasing daytime concentrations • Shift in seasonal pattern: peaks occur earlier in the year
Motivation: Chicago Case Study • Past Modeling analysis has predicted future NOx reductions will lead to changes in spatial and temporal patterns of ozone • Different response seen in urban core versus suburban and outlying areas Chicago Mean May-Sept MDA8: 2006-2008 obs Chicago Mean May-Sept MDA8: 75% NOx cuts
What Can Ambient Data Tell Us About These Trends? • We have an extensive ground-based ozone monitoring network with data dating back to the 1970’s • The past 15 years provide a “natural experiment” to look at ambient ozone trends over a period of dramatically decreasing NOx emissions • U.S. NOx emissions dropped from 22.6 million TPY in 2000 to 12.9 million TPY in 2011 (43%) • Caution: past trends may not reflect behavior which will occur from future emissions reductions
Satellite-Derived NO2 Trends Aura OMI tropospheric NO2 Column Density: 2005 Aura OMI tropospheric NO2 Column Density: 2011
Ozone Trends at Monitoring Sites across the U.S. Segregated by: • Percentile • High ozone (95th percentile) • Low ozone (5th percentile) • Mid-range ozone (mean/median) • Region • Season • Warm season (May – September) • Cool season (April – October) • Degree of Urbanization
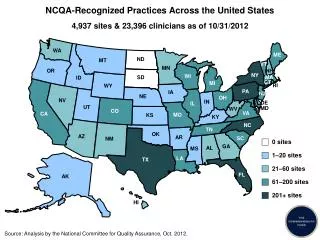
Mean Ozone Percent of Monitors with Statistically Significant Ozone Trends from 1998-2011 • Looked at statistically significant trends in seasonal means of 8-hr daily max ozone (p-value < 0.05) • Only ~20% of monitors nationally have statistically significant trends in mean ozone • This plot shows trends by degree of urbanization and season • Rural sites on left (sum-win) • Suburban sites in middle (sum-win) • Urban sites on right (sum-win)
Ozone trends were evaluated by ozone metric (columns) and by region of the US (rows) • This talk will focus on differences in trends for different portions of the ozone distribution (metric)
Trends in High Ozone Concentrations • 95th Percentile ozone concentrations have decreased across seasons, regions, and urban classifications • Demonstrates large scale success of US control strategies which target peak ozone concentrations • 1-2 ppb/yr 13 – 26 ppb decreases over this time period 5th percentile 50th percentile 95th percentile mean 25th percentile 75th percentile
Trends in High Ozone Concentrations • 95th Percentile ozone concentrations have decreased across seasons, regions, and urban classifications • Demonstrates large scale success of US control strategies which target peak ozone concentrations • 1-2 ppb/yr 13 – 26 ppb decreases over this time period Urban May-Sep Trends Suburban May-Sep Trends Rural May-Sep Trends
Trends in Low Ozone Concentrations • 5th Percentile ozone concentrations have increased across seasons, regions, and urban classifications • Past studies have characterized the influence of increasing background ozone levels on low ozone concentrations • Little work has looked at impact of regional NOx reductions 5th percentile 50th percentile 95th percentile mean 25th percentile 75th percentile
Trends in Low Ozone Concentrations • 5th Percentile ozone concentrations have increased across seasons, regions, and urban classifications • Past studies have characterized the influence of increasing background ozone levels on low ozone concentrations • Little work has looked at impact of regional NOx reductions Urban May-Sep Trends Suburban May-Sep Trends Rural May-Sep Trends
Trends in Midrange Ozone Concentrations • Both increasing and decreasing trends seen in median ozone • Decreases most commonly seen in rural sites • Increases most commonly seen in urban sites • Linkage to degree of urbanization suggests that these trends may be related to NOx disbenefits 5th percentile 50th percentile 95th percentile mean 25th percentile 75th percentile
Trends in Midrange Ozone Concentrations • Both increasing and decreasing trends seen in mid-range ozone • Decreases most commonly seen in rural sites • Increases most commonly seen in urban sites • Linkage to degree of urbanization suggests that these trends may be related to NOx disbenefits Urban May-Sep Trends Suburban May-Sep Trends Rural May-Sep Trends
Conclusions • Increase in low ozone concentrations and decrease in high ozone concentrations leads to a compression of the observed range of ozone values • Modeling suggests that this compression will also lead to less temporal and spatial variability • Health studies which often derive correlations based on area-wide averages of ozone should consider implications of these changes for the design of their studies • US control strategies have been largely successful at targeting peak ozone concentrations
Urbanization Classifications based on NLCD land use categories Image reproduced from NLCD 2006 product data downloads: http://www.mrlc.gov/nlcd06_data.php