Download

1 / 23
230 likes | 327 Views
Economic Models for Impact Assessment Steven R. Miller Senior Research Analyst Center for Economic Analysis Presented to the MI-SBTDC. Economic Models for Impact Assessments. An economic model is a simplification of reality

E N D
Economic Models for Impact Assessment Steven R. Miller Senior Research Analyst Center for Economic Analysis Presented to the MI-SBTDC
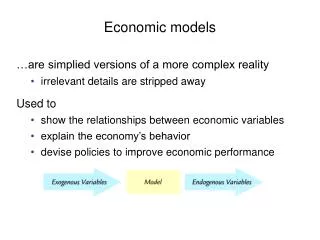
Economic Models for Impact Assessments • An economic model is a simplification of reality • Models are based on mathematical equations that provide a simplified picture of employment and income relationships
Economic Models for Impact Assessments, continued • Economic impact models are used to assess the impacts of shocks to the existing economic structure • Shocks take many forms • Increase in export demand for a locally produced good or service • Increase in capital from outside the region (SBA loans and grants) • Changes in federal, state, and local tax codes • New social structures like an arena • Reallocation of resources from one activity to another
Economic Models for Impact Assessments, continued • The accuracy of the impact assessment depends on: • The appropriateness of the model assumptions • The accuracy of the shock supplied to the model • The user’s understanding of the model structure in interpreting the results
Appropriateness of the Model Assumptions • Consider two models of the labor market using different assumptions about wage rates. • Both models are valid, but the concept of validity is a moving target Wages are assumed fixed Wages are assumed flexible
Appropriateness of the Model Assumptions • The fixed wage model produces a greater increase in labor for a given increase in demand • The fixed wage model is most appropriate for • Small shocks to the economy • Economies with high unemployment • The flexible wage model is most appropriate for • Large shocks to the economy • Economies with low unemployment
Types of Impact Assessment Models Custom or Off-the-shelf? • Custom models generally • Better represents the local economy • Are extremely expensive to acquire • Off-the-shelf • Standardized structure across all regions • Less expensive to acquire
Off-the-shelf Models • All off-the-self models share common characteristics • Use nationally standardized and reported data • Rely on a core Input-Output model to capture relationships across industries • Regional detail for models are generally derived by adjusting national data to fit the local economy • Hence, off-the-self models are fairly comparable.
The Input-Output Table • Input-Output table estimates what each industry buys from all other industries within the region to make a dollar’s worth of output. • When one industry increases production, it increases its purchases of inputs from other industries. • Hence a $1 increase in production will generally lead to more than $1 increase in production in all industries
The Input-Output Table: Example • Example • Steel industry uses coal to fire its blast furnaces and to mix with iron ore • Coal industry uses steel in its equipment and to brace tunnels • When steel is sold, demand for coal increases • When coal is sold, demand for steel increases
The Input-Output Table: Example • Imagine that • $100 of steel requires $10 of coal • $100 of coal requires $5 of steel • Imagine that both industries are found locally • Consider the local impacts if a new customer buys $100 worth of steel
The Input-Output Table: Example • Hence a $100 purchase has led to more than $100 worth of local production • The ratio of Total Impact to Direct Impact is known as the multiplier and is always greater than 1 • In our example: • This multiplier is the same if the increase in demand for steel is $100, $200, or $1 million • Simply take the dollar value and multiply it by the multiplier to get the total impact
The Input-Output Table, Continued • This example demonstrates the working of the core of all off-the-shelf models • Rather than limiting the relationships to two industries, these models track the local input requirements of all local industries • RIMS, IMPLAN, and EconomicImpact report the full spectrum of federally reported industries • REMI aggregates industries into 169 categories
The Input-Output Table, Continued • In a similar fashion household wages and expenditures are recorded. In the steel/coal example, • both the steel and the coal industries hire additional workers to produce the added output • These additional workers spend part of their wages on goods and services provided locally • Benefiting firms will similarly hire additional workers to accommodate the increased demand.
Off-the-shelf Models, Continued • Several options exist for off-the-shelf models. • BEA RIMS II (Bureau of Economic Analysis) • Impact and Planning (Minnesota IMPLAN Group) • Policy Insight (REMI, Inc.) • EconomicImpact (EMSI)
Back to Off-the-Shelf Models RIMS II • Provides only the Multipliers for 473 industries • Useful in building custom models around the input-output table • Inexpensive (about $225 per district) • Static, making no room for modification of the underlying data • Data is updated every five-years
Back to Off-the-Shelf Models IMPLAN Pro. • Provides the modeling environment used to produce the RIMS II multipliers for 509 industries • Dynamic in that it allows the user to provide informed modifications to the underlying data • Inexpensive ($2000 per year) • Data is updated annually • Expands on RIMS to include flows to and from government sectors • STRICTLY DEMAND DRIVEN
Back to Off-the-Shelf Models Policy Insight • Expands on the IMPLAN methodology with greater model coverage for 169 industries • Dynamic in that it allows the user to provide informed modifications to the underlying data • Expensive (varies based on number of industry components and geographic area for model) • Relaxes many of the model assumptions fund in IMPLAN • PROVIDES BOTH SUPPLY-SIDE AND DEMAND-SIDE IMPACTS • Provides forecasts
Back to Off-the-Shelf Models EconomicImpact EMSI (Limited information on) • This model seems to be built to identify human resource needs (training, occupations, etc.) • Provides the modeling environment used to produce the RIMS II multipliers • Dynamic in that it allows the user to provide informed modifications to the underlying data before calculating the multipliers • Web-based • Provides forecasts