Download
1 / 16
360 likes | 712 Views
EXCEL TUTORIAL. SPREADSHEET. Parts of the Excel 2007 Screen. What are spreadsheets?. A spreadsheet application is a computer program such as Excel, Lotus 1-2-3, OpenOffice Calc , or Google Spreadsheets.

E N D
EXCEL TUTORIAL SPREADSHEET
What are spreadsheets? • A spreadsheet application is a computer program such as Excel, Lotus 1-2-3, OpenOfficeCalc, or Google Spreadsheets. • It has a number of built in features and tools, such as functions, formulas, charts, and data analysis tools that make it easier to work with large amounts of data.
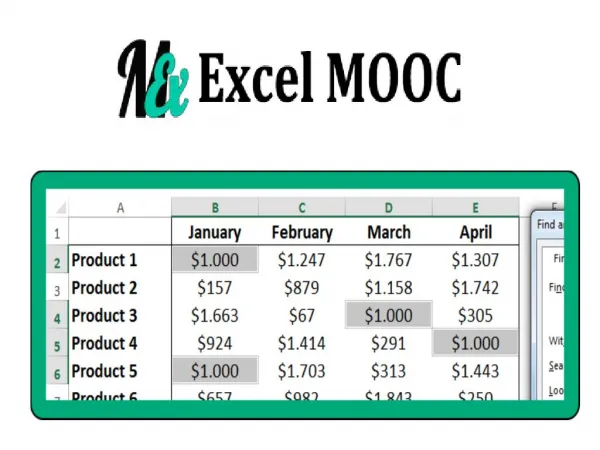
Definition: • A spreadsheet is a table used to store various types of data. • The data is arranged in rows and columns to make it easier to store, organize, and analyze the information.
Workbooks • A workbook is a spreadsheet file. By default, each workbook in Excel contains three pages or worksheets. • The term spreadsheet is often used to refer to a workbook, when in actual fact, spreadsheet refers to the computer program, such as Excel. • So, strictly speaking, when you open the Excel spreadsheet program it loads an empty workbook file consisting of three blank worksheets for you to use.
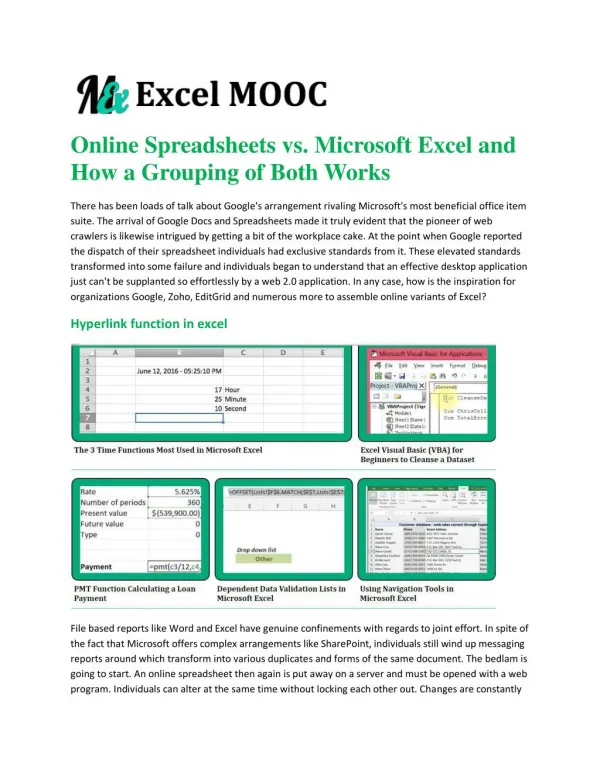
Charts • A graph, or a chart as it is known in Excel, is a visual representation of worksheet data. • A chart is based on a selection or range of related data. A chart often makes it easier to understand the data in a worksheet because users can easily pick out patterns and trends illustrated in the chart that are otherwise difficult to see.
Chart Wizard • The quickest and easiest way to create a chart in Excel is to use the Chart Wizard. The Chart Wizard is composed of a series of dialog boxes that give you all the available options for creating a chart.
Graphs • Graphs in a spreadsheet program such as Lotus 1-2-3 and Quattro Pro are similar to what we call graphs in math class. In Microsoft Excel they called charts.
Visualizations • Graphs then, are visual representations of worksheet data. Graphs often makes it easier to understand the data in a worksheet because users can easily pick out patterns and trends illustrated in the graph that are otherwise difficult to see.
Types • Different types of graphs serve different purposes.
GRAPHS • Examples: • Graphs, or Charts as they are known in Microsoft Excel, provide a visual representation of worksheet data for the user. A number of different types of graphs, such as a pie graphs, bar graphs, and line graphs can be created with an electronic spreadsheet such as Lotus 1-2-3 or Quattro Pro.
Types of Graphs • Bar Graphs • Line Graphs • Pie Graphs
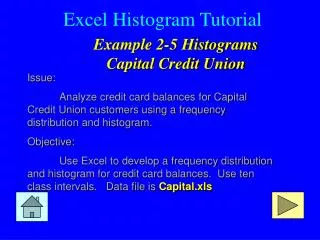
Pie Graphs • Pie Graphs -- are used to show percentages. For example, a pie graph could be used to show what percentage of your total daily calorie intake is represented by one quadruple cheese and bacon hamburger.
Bar Graphs • Bar Graphs-- are used to show comparisons between items of data. Each column in the graph represents the value of one item of data. An example of this would be to compare the calories in a quadruple cheese and bacon hamburger with the calories in a glass of water and a bowl of beet greens.
Line Graphs • Line Graphs-- are used to show trends over time. Each line in the graph shows the changes in the value of one item of data. For example you could show changes in the values of three different stocks over a period of months.