Download
1 / 126
1.29k likes | 1.63k Views
Ecosystem Ecology I. Introduction II. Energy Flow III. Biogeochemical Cycles IV. Productivity, Diversity, and Stability. A. Productivity. A. Productivity 1. Gross Primary Productivity?. A. Productivity 1. Gross Primary Productivity Total photosynthetic productivity;

E N D
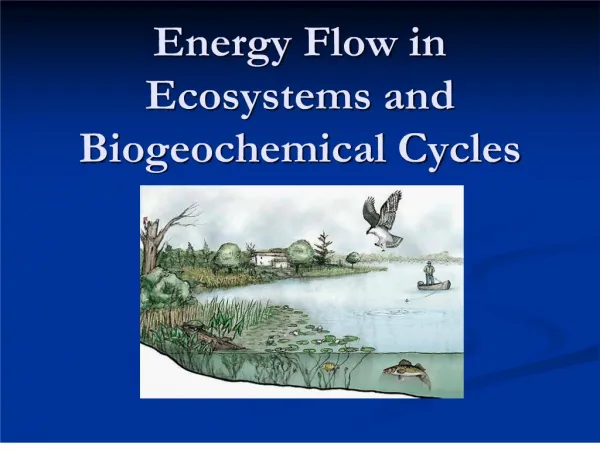
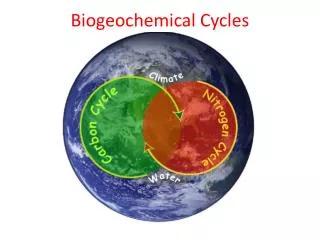
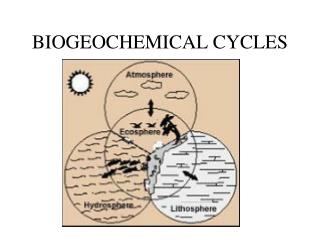
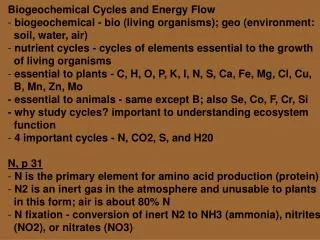
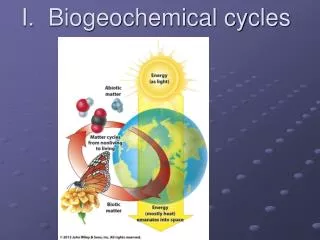
Ecosystem Ecology I. Introduction II. Energy Flow III. Biogeochemical Cycles IV. Productivity, Diversity, and Stability
A. Productivity 1. Gross Primary Productivity?
A. Productivity 1. Gross Primary Productivity Total photosynthetic productivity; CO2 + H20 -----> Glucose + O2
A. Productivity 2. Net Primary Productivity?
A. Productivity 2. Net Primary Productivity NPP = GPP - respiration (Plants use some of the energy they absorb; it is not stored as biomass. NPP is only the amount stored as new biomass.)
B. Diversity - Relationships with Productivity 1. Productivity increases diversity
B. Diversity - Relationships with Productivity 1. Productivity increases diversity - QUANTITATIVE EFFECT If you have more productivity at the base of a food web, then you can build a longer food chain (adding additional levels AND species)…. And then get keystone effects.
B. Diversity - Relationships with Productivity 1. Productivity increases diversity - QUALITATIVE EFFECT An increase in productivity may also occur because more types of food have been added. This may allow for more specialization at the next trophic level - and the coexistence of more species.
B. Diversity - Relationships with Productivity 1. Productivity increases diversity 2. Diversity increases productivity
- Sampling Effects More diverse communities are more likely to contain the most productive species, and thus raise the total productivity.
- Niche Complementarity More diverse communities are more likely to contain different types of species that use different types of energy... thus more efficiently harvesting the available energy
Monoculture Polyculture They all need the same things at the same concentrations; have to place them far apart to reduce competition. Combinations of different plants can be planted at higher density, and they use different "niches" and coexist. Even if abundance of "most productive" species, drops, this loss can be offset.
- Positive Interactions More diverse communities may contain species that benefit other species, and thus increase the productivity of the whole community
Monoculture Polyculture without beans with beans They all need the same things at the same concentrations; have to place them far apart to reduce competition. Nitrogen fixing legumes (beans) nutrify the soil, increasing the growth of other plants
Diversity and Productivity in a Long-Term Grassland Experiment Tilman, et al. 2001. Science 294. 843 - 845 Cedar Creek Ecosystem Science Reserve - 168 9 m x 9 m plots - 1, 2, 4, 8, or 16 species randomly chosen from a pool of 18 species: 4 species, each, of C4 grasses, C3 grasses, legumes, non-legume forbs; 2 species of woody plants. - ~35 replicates of each treatment
Diversity and Productivity in a Long-Term Grassland Experiment Tilman, et al. 2001. Science 294. 843 - 845 Dotted line is biomass in a monoculture of the most productive species. Higher productivity than this, at higher richness values, means niche complementarity or positive effects must be occurring.
Diversity and Productivity in a Long-Term Grassland Experiment Tilman, et al. 2001. Science 294. 843 - 845 Dotted line is biomass in a monoculture of the most productive species. Higher productivity than this, at higher richness values, means niche complementarity or positive effects must be occurring. So, many random assemblages of multiple species have biomass above that of the most abundant monoculture (can’t just be sampling effect).
Diversity and Productivity in a Long-Term Grassland Experiment Tilman, et al. 2001. Science 294. 843 - 845 Dotted line is biomass in a monoculture of the most productive species. Higher productivity than this, at higher richness values, means niche complementarity or positive effects must be occurring. So, many random assemblages of multiple species have biomass above that of the most abundant monoculture. And we might expect greater niche complementarity in natural systems…
Additional Experiments and Results: - Foliar fungal disease incidence decreased at higher diversity because of greater distance between individuals of a species, and resultant lower rates of disease spread (Mitchell et al. 2002). (“Dilution Effect”) - Greater plant diversity led to greater diversity of herbivorous insects, and this effect continued up the food web to predator and parasitoid insects (Haddad et al. 2001). (“Qualitative Effects of Diversity”)
Additional Experiments and Results: - Fewer novel plant species invaded higher diversity treatments because of their lower soil NO3 levels, greater neighborhood crowding and competition, and greater chance that functionally similar species would occur in a given neighborhood (Figs 3; Naeem et al. 2000, Kennedy et al. 2002, Fargione et al. 2003, Fargione and Tilman 2005a, 2005b). Greater plant species numbers led to greater ecosystem stability (lower year-to-year variation in total plant biomass) but to lower species stability (greater year-to-year variation in abundances of individual species), with the stabilizing effect of diversity mainly attributable to statistical averaging effects and overyielding effects (Fig 4; Tilman et al, submitted). Data gathered this past field season shows that soil total C has now become an increasing function of plant species numbers (Fig 5).
Additional Experiments and Results: - Greater plant species numbers led to greater ecosystem stability (lower year-to-year variation in total plant biomass) but to lower species stability (greater year-to-year variation in abundances of individual species).
Additional Experiments and Results: - Stored soil carbon increases with diversity.
- Effects of Genetic Diversity Example Crutsinger, et al. 2006. Science 313: 966-968. Methods: - 63 1m2 plots, each containing 12 plants of all goldenrod. - The plants in a plot represent either 1, 3, 6, or 12 genotypes, randomly selected from a pool of 21 genotypes.
- Example Crutsinger, et al. 2006. Science 313: 966-968. Results: 1: ANPP correlated with number of genotypes in plot.
- Example Crutsinger, et al. 2006. Science 313: 966-968. Results: 1: ANPP correlated with number of genotypes in plot. 2: Total insect species diversity, and diversity of herbivores and predators, correlate with ANPP and number of genotypes per plot.
- Example Crutsinger, et al. 2006. Science 313: 966-968. Results: 3. The effects were non-additive; there were more arthropods (and herbivores and predators) in 6 and 12 species plots than predicted by adding the richness values of the monocultures.
- Example Crutsinger, et al. 2006. Science 313: 966-968. Results: 4: ANPP increase is NOT due to a sampling effect. Evidence favors niche complementation (p = 0.07).
- Example Crutsinger, et al. 2006. Science 313: 966-968. Results: 5: Increase in herbivorous insects due to both MORE food (ANPP - quantitative effect) and DIFFERENT food (niche differentiation - qualitative effect).
- Example Crutsinger, et al. 2006. Science 313: 966-968. Results: 6: Increase in predator richness due to increase in herbivore richness, not AMOUNT of food. Some herbivores were only associated with some genotypes.
- Example Crutsinger, et al. 2006. Science 313: 966-968. Conclusions: ANPP increased with genetic diversity, probably as a function of niche complementarity.
- Example Crutsinger, et al. 2006. Science 313: 966-968. Conclusions: ANPP increased with genetic diversity, probably as a function of niche complementarity. Diversity in higher trophic levels increased with increased ANPP and greater genetic diversity. Herbivore richness is a function of both increased abundance and niche complementarity. Predators increase largely due to a greater variety of herbivores.
- Example Crutsinger, et al. 2006. Science 313: 966-968. Conclusions: ANPP increased with genetic diversity, probably as a function of niche complementarity. Diversity in higher trophic levels increased with increased ANPP and greater genetic diversity. Herbivore richness is a function of both increased abundance and niche complementarity. Predators increase largely due to a greater variety of herbivores. So, genetic variation WITHIN species, and not just diversity among species, may be critical to the conservation of productive and species-rich communities.
C. Effects on Stability 1. Types - "resistance to change" - "resilience after change"
C. Effects on Stability 1. Types 2. Relationships with diversity - more diverse communities are less susceptible to single "types of disturbance" - (a pest, a flood, a drought) - because the many species are unlikely to be sensitive to the same thing.
C. Effects on Stability Biodiversity and Ecosystem Functioning: Current Knowledge and Future Challenges. Loreau, et al. 2001. Science 294: 804 - 808 As richness increases, communities become less variable (more stable).
C. Stability 1. Types 2. Relationships with diversity - diverse communities may recover more rapidly, too (resilience).... but they may not. Fisheries ... yes Rain forest... maybe not
Stimulate condensation and precipitation Volatiles released Rainforests feed themselves and water themselves. Decomposition rapid Absorption rapid
CUT FOREST DOWN Select for fire-adapted grasses.... rainforest doesn't come back.... REDUCE RAINFALL... REDUCE NUTRIENTS INCREASE FIRE
RAINFOREST (wet, few fires) "Multiple Stable States" GRASSLAND (dry, many fires)
We are dependent on the environment for food and resources. Ideally, we would like a STABLE, PRODUCTIVE supply of these resources.... right?? FEAST FAMINE
(We don't want "boom and bust", "feast and famine" scenarios....) FEAST FAMINE
We are dependent on the environment for food and resources. Ideally, we would like a STABLE, PRODUCTIVE supply of these resources.... right?? (We don't want "boom and bust", "feast and famine" scenarios....) STABILITY ? PRODUCTIVITY
We are playing jenga with our life support systems... de Ruiter et al. 2005. Food Web Ecology: Playing Jenga and Beyond Science 309:68 - 71
de Ruiter et al. 2005. Food Web Ecology: Playing Jenga and Beyond Science 309:68 - 71
“The pale blue dot” …. Earth from the Voyager spacecraft, > 4 billion miles away http://solarsystem.nasa.gov/multimedia/display.cfm?IM_ID=2148
http://www.solstation.com/stars/earth.htm http://nssdc.gsfc.nasa.gov/photo_gallery/photogallery-mars.html