Download
1 / 10
100 likes | 224 Views
Chapter 18 explores the regression approach to ANOVA, detailing how to handle independent variables (IVs) with two or more levels. It explains the calculation of Pearson's correlation, differentiation between point-biserial r and other correlations, and the need for coded variables when IVs have more than two levels. It highlights dummy coding and effect coding as methods for representing IVs in analyses. Additionally, it discusses the importance of controlling unwanted subject variance in data collection using various design methods.

E N D
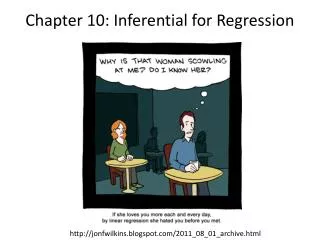
Chapter 18:The Regression Approach to ANOVA • If an Independent Variable has only two levels — even if the two levels represent two qualitatively different categories (e.g., phobic patients and depressed patients) — an ordinary Pearson r can be calculated between the IV and a continuous DV, by assigning any two numbers arbitrarily to the two levels of the IV (in this case, the r is usually called a point-biserialr, and its sign is ignored). • If the IV has more than two qualitative levels (e.g., phobic, depressed, and obsessive patients), assigning arbitrary numbers to those levels will not result in a meaningful correlation with a DV. To correlate three or more levels of an IV with a DV, it is necessary to create a set of arbitrarily coded variables with which to represent the IV. • If the number of different levels of the IV is represented by the integer k, then the number of coded variables needed to represent the IV is k – 1. • Two common systems for creating these coded variables are called Dummy Coding and Effect Coding; examples of these coding systems will be shown next. For Explaining Psychological Statistics, 4th ed. by B. Cohen
One-Way ANOVA: 4 Levels • IV:Three types of anti-depressant drugs (MAOI, SSRI, SNRI) and a placebo, each given to a different sample of participants. • DV:Reduction in depression (BDI_change). • DUMMY CODING: Placebo used as a reference group. Three “dummy” variables required, as follows: • If each of the Ssabove were at the mean of their groups, the prediction equation for the means would be: • Y’ = 2 (MAOI) + 8 (SSRI) + 11 (SNRI) + 3 • Note that the slopes multiplying the MAOI, SSRI, and SNRI variables (2, 8, and 11, respectively) in the equation above are the differences of their means from the placebo mean (3). For Explaining Psychological Statistics, 4th ed. by B. Cohen
One-Way ANOVA: 3 Levels • IV:Three types of anti-depressant drugs (MAOI, SSRI, SNRI), but noplacebo, given to three different samples. • DV:Reduction in depression (BDI_change). • EFFECT CODING: MAOI is used as the arbitrary reference group. Two “dummy” variables required, as follows: If each of the Ssabove represents his/her group mean, the prediction equation for those means would be: Y’ = 4 (SSRI) + (SNRI) + 10 Note that the slopes of the SSRI and SNRI variables (4 and 1, respectively) are their mean differences from the grand mean, which equals 10. For Explaining Psychological Statistics, 4th ed. by B. Cohen
Effect Coding for Two-Way ANOVA • IV #1: Gender (Male = +1; Female = –1). • IV #2: Handedness (Right = +1; Left = –1). • DV: Score on spatial ability (SA) test (0 to 50). • In the spreadsheet below, X1 = Gender, X2 = Hand, and X1X2 = the Interaction of the two factors. For each S, the code for X1X2 is found by multiplying the correspon-ding codes for X1 and X2 . If each of the Ssabove were at the mean of their groups, the prediction equation for the means would be: Y’ = 6 (Gender) – 1 (Handedness) – 2 (Inter’n) + 32 Note that the slopes multiplying the two factors (6 and –1, respectively) equal half the difference of the means of the two genders (38 vs. 26) and half the difference of the means of the two handedness groups (33 vs. 31) (the signs of the slopes are just an artifact of the coding choices). For Explaining Psychological Statistics, 4th ed. by B. Cohen
Testing Eta-Squared for Significance • In the example of one-way ANOVA in Section B of Chapter 12 (optimism compared among three groups), η2 was found to be equal to .36. • Testing this proportion for significance by using Formula 18.2 should yield the same F ratio as the ANOVA in that example: • Note that in the calculation above, the true value of η2 for that problem (.3615) was used without rounding it off, so that the result of the calculation would be exactly equal to the F ratio found for the one-way ANOVA in that example. For Explaining Psychological Statistics, 4th ed. by B. Cohen
Methods for Controlling Unwanted Subject Variance • 1. Screen subjects on a “nuisance” variable: For example, in a study of nutrition and health, amount of exercise can affect the results, so the study could be restricted to those who do not choose to exercise at all. Drawbacks: Cannot generalize results to the larger population. Other important variables may be restricted as a byproduct. • 2. Use a Block x Treatment design: The observed range of a nuisance variable which affects the DV is divided into several convenient ranges. Equal numbers of Ssare recruited within each range, forming blocks. The Ssin each block are then randomly assigned to the levels of the IV, and the blocks become the levels of a factor added to the ANOVA. Note: The number of Ssin each block should be a multiple of the number of treatment levels. • 3.Use a Randomized-Blocks design: Ssare matched on a nuisance variable in blocks whose size equals the number of levels of the IV, and then randomly assigned to those levels. Drawback: Hard to arrange unless all Ssare available at the beginning of the study. • 4. Use a Repeated-Measures design: The same S is used at all levels of the IV. Main Drawback: Possible carryover effects. • 5. Use Analysis of Covariance (ANCOVA): See next slides. For Explaining Psychological Statistics, 4th ed. by B. Cohen
ANCOVA as a Semi-Partial Correlation (Exp’t #1) • IV: Method for teaching math — new vs. traditional • DV: Score on final math test • Covariate: Math SAT score (MSAT) • Codes for Method groups: Traditional = 1; New = 2 • Given those codes, a positive correlation between the IV and DV indicates better average performance for the new method group relative to the “traditional” group. The Venn diagram above shows that: • The IV (Method) is positively correlated with the DV, indicating better performance for the new method. • The covariate (MSAT) also shows a positive correlation with the DV (math test score) by virtue of taking up space in the Venn diagram. • The covariate has a positive correlation with the IV as shown by the overlap between MSAT and Method. (This indicates that, despite random assignment, MSAT scores were higher for the new method group than the traditional method, on average.) Method MSAT DV: math test score The ANCOVA F is a test of the semi-partial correlation represented by the shaded portion of the Method circle. Thus, the larger the overlap (i.e., the positive correlation) between the IV and the covariate, the more the ANCOVA F will be reduced relative to the ordinary ANOVA, which is based on the size of the entire Method circle. For Explaining Psychological Statistics, 4th ed. by B. Cohen
ANCOVA as a Semi-Partial Correlation (Experiment #1 continued) New Note that whereas the correlation between MSAT (covariate) and the final math test (DV) appears to be large and positive within each group, the correlation between those two variables across the two groups (ryx) in the figure above would be even larger, given the positive correlation of the two group means (i.e., the New method mean is higher than the Traditional mean on both MSAT and the final math test). One function of the ANCOVA is to remove that positive correlation of the group means by adjusting the group means for the MSAT/final-math-test correlation. The ANCOVA-adjusted Traditional and New method group means will be much closer together on the final math test, which explains why the ANCOVA F would be considerably smaller than the ordinary ANOVA comparing the two groups on the DV. Traditional Final Math Test MSAT For Explaining Psychological Statistics, 4th ed. by B. Cohen
ANCOVA as a Semi-Partial Correlation (Experiment #2) • Experiment #2 differs from #1 in one aspect of its results: The IV and covariate are still positively correlated with the DV, but in Exp’t #2, the correlation between the IV and the covariate is negative (i.e., the New method group has a lower average on MSAT than does the Traditional method group). We cannot show you the corresponding Venn diagram, because we cannot show a “negative overlap” between the IV and the Cov. • Once again, the correlation between MSAT and the final math test appears to be large and positive within each group, but this time the correlation between those two variables across the two groups (ryx) in the figure above would be smaller, given the somewhat negative correlation of the two group means (i.e., now the New method mean is higher than the Traditional mean on the final math test, but lower on MSAT). In this case, when the ANCOVA removes the negative correlation of the group means, the ANCOVA-adjusted Traditional and New method group means will be further apart on the DV, which contributes to the ANCOVA F being considerably larger than the ordinary ANOVA. New Traditional Final Math Test MSAT For Explaining Psychological Statistics, 4th ed. by B. Cohen
Problems to Watch Out for When Performing an ANCOVA • Lack of a linear relationship between the Covar and the DV: Look for bivariate outliers, a curvilinear relationship, or just a very weak linear one, both within each group, and across all groups. These situations can greatly reduce the effectiveness of the ANCOVA. • Interaction between the Covar and the IV: If the Covar/DV relationship (as measured by Pearson’s r) changes considerably from one level of the IV to another, the ANCOVA results are likely to be misleading. You can test for homogeneity of regression. • The measurement of the Covar is not very reliable: This source of error variance can bias the results of the ANCOVA, especially when dealing with intact (not randomly assigned) groups. • The IV and the Covar are not independent: This situation can easily lead to misleading results. If you are manipulating the levels of the IV, make sure that the covariate cannot be affected by those manipulations (e.g., the Covar is measured before the manipulation; the Covar is a stable trait, like age, of the participant). For Explaining Psychological Statistics, 4th ed. by B. Cohen