Download
1 / 1
10 likes | 120 Views
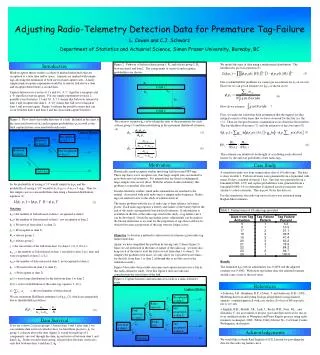
Figure 2. Pathway of fish in release group 1, R 1 and release group 2, R 2 between dam1 and dam2. The components of survival and recapture probabilities are shown. We model this type of data using a multinomial distribution. The likelihood is given in equation (5). Introduction.

E N D
Figure 2. Pathway of fish in release group 1, R1 and release group 2, R2 between dam1 and dam2. The components of survival and recapture probabilities are shown. We model this type of data using a multinomial distribution. The likelihood is given in equation (5). Introduction Mark-recapture theory studies a cohort of marked individuals that are recaptured at a later time and/or space. Animals are marked with unique tags allowing the estimation of both survival and capture rates. A fairly simple mark-recapture experiment would be to release fish above a dam and recapture them before a second dam. Capture histories are a series of 1’s and 0’s. A ‘1’ signifies a recapture and a ‘0’ signifies a non-recapture. For our simple experiment we have 2 possible event histories: 11 and 10. A ’11’ means that fish were released at dam 1 and recaptured at dam 2. A ’10’ means that fish were released at dam 1 and not seen again. Figure 1 outlines the possible events that can occur between dam 1 and dam 2 and the associated capture histories. (5) Due to identifiability problems we cannot get an estimate for 1on its own. However we can get an estimate for 1p2as shown in (6). R1 DAM 1 D R1 R (6) How do we estimate ? p2 DAM 2 First, we make the somewhat bold assumption that the support for this integral consists of the times that we have observed for the fish (i.e. the ti’s). Thus our integral becomes a summation as we discretise the problem. The log-likelihood becomes (7), and our estimator of 1p2 becomes (8). Figure 1. Flow chart of possible histories of a fish. Included in the chart is the associated survival (1)and recapture probabilities (p2)as well as the final capture history associated with each event. We can now estimate D via by taking the ratio of the parameters for each release group (3) and then substituting in the maximum likelihood estimator (4). Capture History (3) Recaptured at dam 2 11 p2 (7) Survival to dam 2 1 (4) Released at dam 1. Not recaptured at dam 2. 1-p2 10 (8) This estimate can intuitively be thought of as inflating each observed history by the survival probability of the radio-tags. Motivation Case Study 1-1 10 Fish Dies Historically, mark-recapture studies involving fish have used PIT-tags. These tags have a low recapture rate, thus large sample sizes are needed to get robust survival estimates. For animals that are listed as endangered, large sample sizes are not ideal. With the advent of radio-telemetry, this problem is somewhat alleviated. In radio-telemetry studies, small radio-transmitters are attached to the animal. Associated with each radio-tag is a unique radio frequency. Radio-tags are relatively new to the study of salmon survival. The major problem with the use of radio tags is their reliance on battery power. Each radio-tag requires a battery and failure of the battery before the end of the study can negatively bias survival estimates. If information is available on the life of the radio-tags used in the study, a tag-failure curve can be developed. Given the tag-failure curve, adjustments can be made to the known detections to account for the proportion of tags that could not be detected because a proportion of the tags were no longer active. Objective: to develop a method to adjust survival estimates given radio-tag failure-time data. Again, we have simplified the problem by having only 2 dams (figure 3). Since we are interested in the time of failure of the radio-tag, we must also keep track of the time it took the fish to travel from dam 1 to dam 2. To simplify the problem even more, we only allow for 2 possible travel times for the fish, from dam 1 to dam 2 (although this is not the case for the simulation study). Figure 4 describes the possible outcomes and capture histories for a fish in this radio-telemetry study. Note that figure 4 does not take into consideration the travel time of the fish. A simulation study was done using failure data of 19 radio-tags. The data is show in table 1. Fish travel times were generated from a lognormal with mean 10 days, standard deviation 1 day. Survival was generated from a binomial(10000, 0.95) and capture probabilities were generated from a binomial(10000, 0.8) to determine if adjusted survival estimates were similar to actual estimates. Thus 1p2=0.76 for this data set. For this simulation, the radio-tag survival curve was estimated using Kaplan-Mier estimates. So the probability of seeing a ’11’ would simply be 1p2 and the probability of seeing a ’10’ would be 1(1-p2) + (1-1) = 1-1p2. Thus for this simple case we can model these data using a binomial distribution, equation (1). (1) Notation n11= the number of fish released at dam 1, recaptured at dam 2. n10= the number of fish released at dam 1, not recaptured at dam 2. 1 = Pr(survival from dam 1 to dam 2). p2 = Pr(recapture at dam 2). R1 = release group 1. R2 = release group 2. ti = the travel time of the fish from dam 1 to dam 2, i=1,2; 0ti. n11,ti = the number of fish released at dam 1, traveled to dam 2 in ti time and were recaptured at dam 2, i=1,2. n10 = the number of fish released at dam 1, not recaptured at dam 2. 1 = Pr(survival from dam 1 to dam 2). p2 = Pr(recapture at dam 2). g(ti) = travel time distribution for the fish from dam 1 to dam 2. S(ti) = survival distribution of the radio-tag; equal to 1- F(ti). Table 1. Failure times of 19 radio-tags provided. Results The estimated 1p2 before adjustments was 0.4059 and the adjusted estimate was 0.4962. With more tag-failure data, the adjusted estimate should come closer to the real value. Figure 4. Capture histories and outcomes for a fish in a radio-telemetry study. References Capture History = the total number of fish released. • Lebreton, J-D., Burnham, K.P., Clobert, J. and Anderson, D.R. (1992). Modeling Survival and testing biological hypotheses using marked animals: a unified approach with case studies. Ecological Monographs, 62(1): 67-118. • English, K.K., Skalski, J.R., Lady, J., Koski, W.R., Nass, B.L., and Sliwinski, C. An assessment of project, pool and dam survival for run-of-river steelhead smolts at Wanapum and Priest Rapids projects using radio-telemetry techniques, 2000. Public Utility District No. 2 of Grant County, Washington, draft report. We use maximum likelihood estimator’s of 1p2 (2), which are inseparable due to identifiability problems. p2 Recaptured at dam 2 11 Radio survives S(ti) Not recaptured at dam 2. (2) 1-p2 Fish survives to dam 2 10 1-S(ti) Dam Survival Radio fails 1 Not recaptured at dam 2. Released at dam 1 1-p2 If we are to have 2 release groups, 1 before dam 1 and 1 after dam 1 we can estimate dam survival (which is how we fund these projects). 1for group 1, released above the dam (figure 2) would be made up of 2 components: survival through the dam, D and survival between dam 1 and dam2, R. In the second release group, released after the dam, survival is only that between dam 1 and dam 2, R. 10 Acknowledgements 1-1 Fish dies 10 We would like to thank Karl English of LGL Limited for providing the data for the radio-tag failure curve. Adjusting Radio-Telemetry Detection Data for Premature Tag-Failure L. Cowen and C.J. Schwarz Department of Statistics and Actuarial Science, Simon Fraser University, Burnaby, BC