Download

1 / 60
660 likes | 1.14k Views
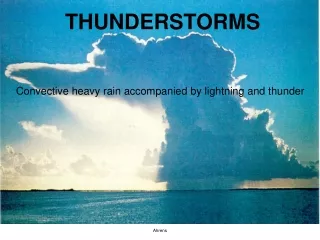
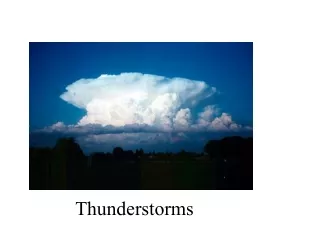
Supercell Thunderstorms. Part II I. Adapted from Materials by Dr. Frank Gallagher III and Dr. Kelvin Droegemeier School of Meteorology University of Oklahoma. Importance of Storm-Relative Winds. We obtain strong updraft rotation if the storm-relative

E N D
Supercell Thunderstorms Part III Adapted from Materials by Dr. Frank Gallagher IIIand Dr. Kelvin DroegemeierSchool of MeteorologyUniversity of Oklahoma
Importance of Storm-Relative Winds We obtain strong updraft rotation if the storm-relative winds are parallel to the horizontal vorticity – or perpendicular to the environmental shear vector – this is easily determined via a wind hodograph Shear Vector Vorticity Vector Storm-Relative Winds Play Movie © 1990 *Aster Press -- From: Cotton, Storms
Assessing S-R Winds • The degree of alignment between the storm-relative wind and the horizontal vorticity is critical for estimating the potential of an updraft to rotate • A particular tool – the wind hodograph – provides a simple graphical mechanism to assess this and other parameters
Wind Hodograph • A wind hodograph displays the change of wind speed and direction with height (vertical wind shear) in a simple polar diagram. • Wind speed and direction are plotted as arrows (vectors) with their tails at the origin and the point in the direction toward which the wind is blowing. This is backward from our station model!!!
Hodograph • The length of the arrows is proportional to the wind speed. The larger the wind speed, the longer the arrow. • Normally only a dot is placed at the head of the arrow and the arrow itself is not drawn. • The hodograph is completed by connecting the dots!
Hodograph -- Example 1000 m 500 m 1500 m SFC 2000 m
Hodograph • Why Draw a Hodograph? • Similar to a thermodynamic diagram – it makes life easier! • We don’t have to look through a complex table of numbers to see what the wind is doing. • By looking at the shape of the hodograph curve we can see, at a glance, what type of storms may form. • Air Mass (garden variety) storms • Multicellular Storms • Supercell Storms • Tornadic Storms • The shear on a hodograph is very simple to determine, as is the horizontal vorticity • This allows us to assess helicity and streamwise vorticity
Hodograph -- Example Just by looking at this table, it is hard (without much experience) to see what the winds are doing and what the wind shear is.
Hodograph -- Example 2000 m • Let us plot the winds using a station model diagram. • This is better but it is time consuming to draw and still is not that helpful. 1500 m 1000 m 500 m SFC
Hodograph -- Example 160 Let us draw the surface observation. 160o at 10 kts Since the wind speed is 10 kt, the length of the arrow is only to the 10 knot ring. The direction points to 160o. • Let us now draw the hodograph!
Hodograph -- Example Let us draw the 500 m observation: 180o at 20 kts Since the wind speed is 20 kt, the length of the arrow is only to the 20 knot ring. The direction points to 180o. • Let us now draw the 500 m observation.
Hodograph -- Example • We now place dots at the end of the arrows then erase the arrows.
Hodograph -- Example • We then connect the dots with a smooth curve and label the points. This is the final hodograph!!! 1000 m 500 m 1500 m SFC 2000 m
Hodograph -- Example • What can we learn from this diagram? • We see that the wind speeds increase with height. • We know this since the plotted points get farther from the origin as we go up. • We see that the winds change direction with height. • In this example we see that the hodograph is curved and it is curved clockwise. • If we start at the surface (SFC) and follow the hodograph curve, we go in a clockwise direction!
Determining the Wind Shear • The wind shear vector at a given altitude is tangent to the hodograph at that altitude and always points toward increasing altitudes • The vector shear between two levels is simply the vector that connects the two levels • Makes assessing the thermal wind vector (location of cold air) trivial!! • The average shear throughout a layer is very useful in forecasting storm type
Shear vector at 2 km 2 km 1 km 3 km SFC
2 km Shear vector between 1 and 2 km 1 km 3 km SFC
2 km 1 km 3 km SFC Shear vector between sfc and 2 km
Determining Horizontal Vorticity • As shown earlier, the horizontal vorticity vector is oriented perpendicular and 90 degrees to the right of the wind shear vector • This is very easily found on a hodograph!
Horizontal vorticity vectors 2 km 1 km 3 km SFC Vertical wind shear vectors
Determining Storm-Relative Winds • We can determine the S-R winds on a hodograph very easily given storm motion • Storm motion is plotted as a single dot
2 km 1 km 3 km SFC Storm Motion (225 @ 30)
2 km 1 km 3 km SFC Storm Motion Vector (225 @ 30)
Determining Storm-Relative Winds • We can determine the S-R winds on a hodograph very easily given storm motion • Storm motion is plotted as a single dot • The S-R wind is found easily by drawing vectors back to the hodograph from the tip of the storm motion vector
2 km 1 km 3 km SFC Storm Motion Vector (225 @ 30) Storm-relative winds can be determined at any level, not just those for which observations are available
Use of Storm-Relative Winds • Why do we care about the S-R winds? • Remember, only the S-R winds are relevant to storm dynamics • In the case of supercell updraft rotation, we want to see an alignment between the S-R winds and the horizontal vorticity vector • This is easily determined on a hodograph
Horizontal Vorticity vectors 2 km 1 km 3 km SFC Storm-relative winds can be determined at any level, not just those for which observations are available
Importance of Storm-Relative Winds We obtain strong updraft rotation if the storm-relative winds are parallel to the horizontal vorticity – or perpendicular to the environmental shear vector – this is easily determined via a wind hodograph Shear Vector Vorticity Vector Storm-Relative Winds Play Movie © 1990 *Aster Press -- From: Cotton, Storms
Estimating the Potential For Updraft Rotation • Ingredients • Strong storm-relative winds in the low-levels (at least 10 m/s) • Strong turning of the wind shear vector with height (90 degrees between the surface and 3 km) • Strong alignment of the S-R winds and the horizontal vorticity – to develop rotating updrafts • All of this can be quantified by a single quantity- the Storm-Relative Environmental Helicity
Storm Relative Environmental Helicity • SREH -- A measure of the potential for a thunderstorm updraft to rotate. • SREH is typically measured over a depth in the atmosphere: • 1 to 3 km • 0 to 4 km • A good helicity estimate depends on accurate winds and storm motion data
Storm Relative Environmental Helicity • SREH is the area swept out by the S-R winds between the surface and 3 km • It includes all of the key ingredients mentioned earlier • It is graphically easy to determine
Storm Relative Helicity 180 This area represents the 1-3 km helicity 3 km 4 km 2 km 5 km 7 km 6 km 1 km Storm Motion SFC 270 SREHPotential Tornado Strength 150 - 300 m2 s-2 Weak 300 - 500 m2 s-2 Strong > 450 m2 s-2 Violent
Typical Single-Cell Hodograph • Weak shear, weak winds
Typical Multicell Hodograph • Somewhat stronger winds and shear, with S-R winds providing mechanism • Hodograph is essentially straight, especially at low levels
Typical Supercell Hodograph • Strong wind, shear vector turns with height, strong S-R winds • Note curved shape of hodograph at low levels
Which Storm Motion Produces a Strong, Cyclonically-Rotating Supercell? 2 km 1 km 3 km SFC Storm Motion Vector (225 @ 30)
Estimating the Potential For Updraft Rotation • Ingredients • Strong storm-relative winds in the low-levels (at least 10 m/s) • Strong turning of the wind shear vector with height (90 degrees between the surface and 3 km) • Strong alignment of the S-R winds and the horizontal vorticity – to develop rotating updrafts
Speed of S-R Winds Alignment of S-R Winds and Vorticity Horizontal Vorticity vectors 2 km 1 km 3 km SFC Storm-relative winds
Storm-Relative Environmental Helicity Horizontal Vorticity vectors 2 km 1 km 3 km SFC Storm-relative winds
Speed of S-R Winds Alignment of S-R Winds and Vorticity Horizontal Vorticity vectors 2 km 1 km 3 km SFC Storm-relative winds
Speed of S-R Winds Alignment of S-R Winds and Vorticity Horizontal Vorticity vectors 2 km 1 km 3 km SFC Storm-relative winds
Storm-Relative Environmental Helicity Horizontal Vorticity vectors 2 km 1 km 3 km SFC Storm-relative winds
Speed of S-R Winds Alignment of S-R Winds and Vorticity Horizontal Vorticity vectors 2 km 1 km 3 km SFC Storm-relative winds
Storm-Relative Environmental Helicity Horizontal Vorticity vectors 2 km 1 km 3 km SFC Storm-relative winds
Making an Optimal Hodograph 3 km 2 km 1 km SFC
Making an Optimal Hodograph 3 km 2 km 1 km SFC Note unidirectional shear, but Ground-relative winds veer with height
Making an Optimal Hodograph Horizontal Vorticity vectors 3 km 2 km 1 km SFC