Download
1 / 15
150 likes | 232 Views
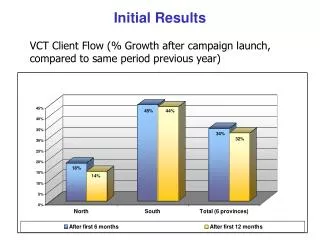
State-of-the-art prediction system using distributed hydrologic models for flash flood forecasting. Utilizes radar and precipitation data for accurate risk assessment. Collaboration with NOAA and University of Oklahoma enhancing real-time simulations.

E N D
Initial Results and Future Applications of a CONUS-wide Flash Flood Prediction System Zachary Flamig Zac.Flamig@noaa.gov University of Oklahoma/School of Meteorology NOAA/National Severe Storms Laboratory In collaboration with: JJ Gourley Suzanne Van Cooten Yang Hong Humberto Vergara NOAA/NSSL NOAA/NSSL OU/CEES OU/CEES October 25th, 2010 National Flood Workshop, Houston, TX
Looking inland… Floods & Flash Floods around May 1st Nashville, TN >$1 Billion in damage Flash Flood on June 14th Oklahoma City, OK >$1 Million in damage Flash Flood on June 10th Albert Pike Campground, AR 20 Fatalities AP Photos
X Flash Flood Prediction? State of the Art: Gridded Flash Flood Guidance* • Distributed hydrologic model for soil moisture accounting • Rainfall/runoff model for runoff potential prediction • Static model for critical runoff threshold estimation Ultimately derives rainfall threshold which if exceeded means flash flooding is occurring or will occur! *Schmidt, J., A. J. Anderson, and J. H. Paul, 2007: Spatially-variable, physically-derived flash flood guidance. Preprints 21st Conference on Hydrology, San Antonio, Amer. Meteor. Soc., 6B.2.
Flash Flood Prediction National Mosaic and Multi-Sensor QPE (NMQ-) Flooded Locations And Simulated Hydrographs (FLASH) Probability 0 1,000 People Affected Observed Precipitation Distributed Hydrologic Models Streamflow Flood Exposure Model Probability Return Period Forecast Precipitation $0 >$5M Property Damage time time Requirements: Flash Flood Scale (1 km2, Sub-Hourly Time Scale) Probabilistic (Ensemble) Prediction Probability $0 >$1M Crop Damage
Getting Observed Precipitation • NMQ Q2, radar only product • 0.01º x 0.01º (~1km x 1km) • 2.5 minute update • Long term reanalysis (soon!)
Precipitation Forecasts • Cloud resolving NWP from 4km2 to 1km2 • HRRR primary candidate because it assimilates NMQ 3D radar reflectivity field
Hydrologic Models HL-RDHM CREST • Developed by NWS • Runs operationally at RFCs • Jointly developed by OU/NASA • Runs operationally over globe
Simulated Threshold Frequency • Requires a long archive of precipitation (10+ years) • Run the model using the precipitation archive • Compute Log Pearson-III flood frequencies for each grid cell USGS 07196500 Illinois River near Tahlequah, OK
Flood Exposure Model • Risk = Hazard (dynamic) * Vulnerability (static) • Property damage from ABRFC area for flash floods • Utilizes StormDat polygon data from 2006-2010 • Only hazard information used in shown figure
Event Type: Flood Start Time: 6/27/2008 11:30 A.M. Latitude: 38.013824 Longitude: -96.715266 County: Butler State: Kansas Flood Nature: Overflow road other Depth: 0.3 m Lateral Extent: 300 m Comments: Horse corral on location was flooded. Creek flooded 1/4 mile west from location. Road closed at 150th and Highway 77. Verification Methods Event Type: Flash Flood WFO: OUN Begin Date: 3/20/2007 Begin Time: 9:30 A.M. CST County: Kay State: OK • NWS flash flood reports (StormDat) • Designed to encompass all events in forecaster’s area of responsibility • Dependent upon NWS warning process, population density • 15-minute streamflow data from USGS • Objective measurement of discharge • Need flashy basins with basin area < 260 km2 (flash flood scale) • Flash flood defined as 2-year return period • SHAVE flash flood reports • High spatial and temporal resolution • Flood characteristics • Database is storm-targeted; does not encompass all flash flood events • Dependent on population density
Severe Hazards Analysis and Verification Experiment (SHAVE)* • SHAVE reports are more dense than NWS reports (e.g., 50:1) • Unique data collected in SHAVE • Reports of no flooding • Specific impact • Lateral extent/depth/motion of water • Respondent-estimated frequency • Lightning Creek flooding, OKC July 2010 *Ortega, K.E., T.M. Smith, K.L. Manross, A.G. Kolodziej, K.A. Scharfenberg, A. Witt, and J.J. Gourley, 2009: The severe hazards and verification experiment, Bull. Amer. Meteor. Soc., 90, 1519-1530.
Back to the Coast! • Distributed hydrologic model (HL-RDHM) run for Tar & Neuse basins. • Green dots represent verification points • Red dots are hand-off points for hydrodynamic ocean model (ADCIRC) • NMQ-FLASH will allow for distributed hydrologic model results from anywhere in the CONUS including other coastal areas (Texas, South Carolina, etc)
Real-time Simulations • Non-optimized ensemble produces reasonable spread already at this early stage; optimized ensemble from NMQ-FLASH will produce a spread that completely envelopes the observed hydrograph.
National Mosaic and Multi-Sensor QPE (NMQ-) Flooded Locations And Simulated Hydrographs (FLASH) - A CONUS-wide flash-flood forecasting demonstration system • NMQ/Q2 Rainfall Observations • 1km2/2.5 min • Stormscale Rainfall Forecasts Probabilistic Forecast Return Periods and Estimated Impacts Stormscale Distributed Hydrologic Models Hydrograph of Simulated and Observed Discharge Simulated surface water flow 6” 8” 40% 5 hr 60% 10” 80% t=0100 t=0000 Q5 Q2 t=2300 20 fatalities Probability of life-threateningflash flood 10-11 June 2010, Albert Pike Rec Area, Arkansas