Download
1 / 15
150 likes | 286 Views
Assessing the Marginal Cost of Congestion for Vehicle Fleets Using Passive GPS Data. Nick Wood, TTI Randall Guensler , Georgia Tech. Presented at the 13 th National TRB Transportation Applications Conference May 10, 2011 -- Session 13A -- . Overview. Purpose of assessing lost time

E N D
Assessing the Marginal Cost of Congestion for Vehicle Fleets Using Passive GPS Data Nick Wood, TTI Randall Guensler, Georgia Tech Presented at the 13th National TRB Transportation Applications Conference May 10, 2011 -- Session 13A --
Overview • Purpose of assessing lost time • Methodology • Recruiting participants • GT Freight Data Collector • Screening second-by-second GPS data • Reporting results • Implications for tolling • Potential use of regional HOT lane network
Purpose of the Research • Effects of congestion are not well known by users of the system • Quantify lost time experienced by vehicle fleets on the expressway system • Assess how fleets might respond the travel unreliability • Match delay to value of time to arrive at a cost of congestion Photo Credit: Creating Loafing Atlanta
Scope of the Research • Collect second-by-second location and speed data • 12 vehicle fleets • Between 1-5 vehicles per fleet • Roughly 2 weeks per vehicle • Speeds below 45 mph were defined as congestion • Screen GPS data • Select trips that were made on the expressway system in the 13-county metropolitan region • Created a trip dataset based on timestamps • Calculated percent of fleet activity lost • Due to delay and travel time unreliability • Unreliability defined as difference between the 50th and 95th percentiles • Environmental and social externalities were not considered
Fleet Recruitment • Fleets were recruited by phone, letter, and in-person • Cold calling yielded a 10% success rate • Barriers to participating • Understanding what the study was about • Belief that time required would take away from business • Lack of monetary compensation • Privacy was only a secondary concern • Industry types recruited include: • Exterminators • Supermarkets • General Merchandise Stores • Fruit Wholesalers • Concrete Ready-Mix Trucks • Electric Power Utilities • School Buses, Local and Express Transit Vehicles
Creating Individual Trip Records • Done by a GIS-based approach • Date, time, lat, long, and vehicle speed recorded for each second of travel • Buffer of the expressway network used to clip position data • Rules for segmenting trips from raw dataset • Continuous records were labeled to identify the same trip • Gaps of less than 10 sec. were assumed to be the same trip • Eliminated trips of less than 60 sec. or traveled less than 1 mile • Reducing the significance of errors • Roughly 89% of all the data collected was originally good • Instance where 0 mph existed one second after 60 mph, physically impossible • Applied a cubic spline fit to estimate speed using good data • 97% of the total data was used for analysis (inc. original and estimated speeds)
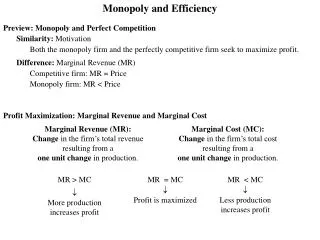
Calculating Lost Time • Congestion defined to be any travel speed below 45 mph • Selected because 45 mph was the lower range of max sustained flow • Calculation steps • Only records with a speed < 45 mph were summed to get a total of congested speeds per trip • The congested speeds within each trip were divided by the number of records with a speed < 45 mph, or time duration of congestion per trip • Difference of average speed during congestion taken with 45 mph • Converted values from seconds to minutes
Results Percent of Fleet Activity Lost to Unreliability per Fleet Vehicle
Linking Delay to Marginal Costs • Associated labor wage rates used to calculate costs due to delay and unreliability • Assumed that value of time = 100% of the employment cost • Included hourly rate along with benefits and taxes paid by employer • Each fleet matched to comparable profession class • Used median wages from Georgia Department of Labor database • Fleets were observed to only have one driver
Unreliability Costs Weekly Costs due to Unreliability per Fleet Vehicle
Limitations • The sample size was relatively small in total and per fleet • Second-by-second data were only collected for a two-week period • The value of time estimates do not include the cost of needing additional vehicles to maintain services due to increasing travel delays • The analysis considered travel speeds on a system-wide basis • Delays are corridor specific and do not occur uniformly across expressway network • Future efforts should be corridor-specific
Conclusions • Roughly 217 hours of raw data observed • Matching observed delay to employment costs was shown to be a reliable estimate for the marginal cost of congestion • Reducing the amount of time a fleet vehicle needs to be inoperable for GPS installation is key to participation • Placing the assembly in a vehicle cab took less than 5 minutes • Median Toll Rates Across All Fleets • Equating to the marginal cost due to travel unreliability • $0.43 per mile for AM period • $0.53 per mile for PM period