Download
1 / 22
220 likes | 330 Views
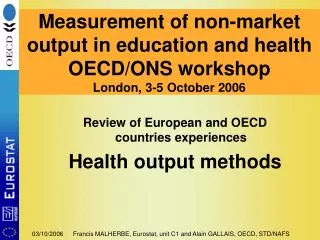
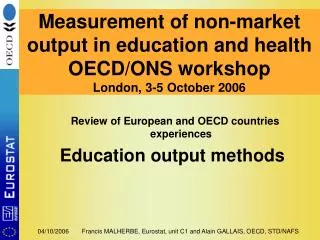
Measurement of non-market output in education and health OECD/ONS workshop London, 3-5 October 2006. Review of European and OECD countries experiences Education output methods. Importance of price and volume measures for the European Union.

E N D
Measurement of non-market output in education and healthOECD/ONS workshopLondon, 3-5 October 2006 Review of European and OECD countries experiences Education output methods Francis MALHERBE, Eurostat, unit C1 and Alain GALLAIS, OECD, STD/NAFS
Importance of price and volume measures for the European Union • The availability of price and volume measures of GDP is essential for: • Monitoring economic development in the EU • The monetary policy of the euro area • The implementation of the Stability and Growth Pact Francis MALHERBE, Eurostat, unit C1 and Alain GALLAIS, OECD, STD/NAFS
Some legal aspects in the EU • Commission Decisions 98/715 and 2002/990 clarified the principles for the measurement of prices and volumes. • This Commission legislation has identified the most appropriate estimation methods to be applied (A and B methods) and the methods which shall not to be used (C methods). • The old Member States were asked to remove the C methods by end 2006. Francis MALHERBE, Eurostat, unit C1 and Alain GALLAIS, OECD, STD/NAFS
Aims of the list of questions • In June 2006 Eurostat sent to all Member States a list of questions on price and volume measurement in the fields of non market health and education services. • The main objective was to assess and monitor Member States progress towards removing C methods by end 2006. • In this context, the sharing of experience between countries is of utmost importance. • During the same month of June 2006, the OECD launched a similar questionnaire to OECD non-EU members, in the perspective of its „non-market project“ (best practices). Francis MALHERBE, Eurostat, unit C1 and Alain GALLAIS, OECD, STD/NAFS
Scope of the list • The list covers solely the output methods currently used or being developed by the countries. • 24 out of 27 EU countries (including Iceland and Norway) replied to the list. • 7 OECD non-EU countries replied to the similar OECD questionnaire, but only 2 (AU, NZ) currently apply output methods and other 2 (KR, US) study a project. Francis MALHERBE, Eurostat, unit C1 and Alain GALLAIS, OECD, STD/NAFS
Structure of the list • The list covers five aspects: • Stratification • Quantity indicators • Weighting • Quality indicators • Availability of the data Francis MALHERBE, Eurostat, unit C1 and Alain GALLAIS, OECD, STD/NAFS
Basic stratification (1) • A and B methods require stratification for, at least, the following categories: • Pre-school (ISCED 0) • Primary (ISCED 1) • Lower secondary (ISCED 2) • Upper secondary (ISCED 3) • Higher education (ISCED 5 and 6) • Other education (ISCED 4 and non formal) Francis MALHERBE, Eurostat, unit C1 and Alain GALLAIS, OECD, STD/NAFS
Basic stratification (2) • This basic stratification of the handbook is not always applied by some EU countries grouping two categories: • Lower and upper secondary (6 cases) • Pre-school and primary (1 case) • Primary and lower secondary (1 case) • Upper secondary and higher education (1 case) • Same problem with AU and EU (primary and lower secondary). Francis MALHERBE, Eurostat, unit C1 and Alain GALLAIS, OECD, STD/NAFS
Complementary stratification • Most countries apply some form of complementary stratification (by region and subject) • Only six EU countries use no complementary stratification Francis MALHERBE, Eurostat, unit C1 and Alain GALLAIS, OECD, STD/NAFS
Stratification • As interesting examples of stratification we can mention: • A stratification in “ordinary“, severly disabled, other disabled used by Finland (also CZ, FR, NO, US for ordinary /disabled) • A distinction between general and vocational education introduced by Finland and Norway (numerous fields) + AT and FR. Francis MALHERBE, Eurostat, unit C1 and Alain GALLAIS, OECD, STD/NAFS
Quantity indicators (1) • Eurostat recommends the use of pupil hours as quantity indicator. • Number of pupils is acceptable if it can be shown that hours per pupil are sufficiently stable. • Number of pupils is recommended for tertiary education and distance-learning Francis MALHERBE, Eurostat, unit C1 and Alain GALLAIS, OECD, STD/NAFS
Quantity indicators (2) • 13 EU countries use mainly number of pupils as quantity indicator. • 11 EU countries use mainly pupil hours or full time equivalent pupils. • In this case most countries have estimated hours per pupil for one benchmark year and for the various categories identified. Then, they have considered that, for each category, hours per pupil are the same every year. Francis MALHERBE, Eurostat, unit C1 and Alain GALLAIS, OECD, STD/NAFS
Quantity indicators (3) Francis MALHERBE, Eurostat, unit C1 and Alain GALLAIS, OECD, STD/NAFS
Quantity indicators (4) M The sources used are mainly administrative data: Francis MALHERBE, Eurostat, unit C1 and Alain GALLAIS, OECD, STD/NAFS
Quantity indicators (5) • As interesting examples we can mention: • UK uses pupils hours estimated as numbers of full time equivalent enrolled pupils adjusted to exclude pupil absences. • Germany uses pupils hours by institutions under the assumption that for each institution they are the same as for the reference years Francis MALHERBE, Eurostat, unit C1 and Alain GALLAIS, OECD, STD/NAFS
Quality indicators (1) • Eurostat recommends the use of adjustments for quality but an output indicator method can be acceptable without quality adjutment (B method). • When they are used, adjustments for quality are mainly based on: • Class size • Scoring of pupils Francis MALHERBE, Eurostat, unit C1 and Alain GALLAIS, OECD, STD/NAFS
Quality indicators (2) Francis MALHERBE, Eurostat, unit C1 and Alain GALLAIS, OECD, STD/NAFS
Quality indicators (3) • As interesting examples we can mention: • UK uses quality adjustment factor calculated to reflect the estimated contribution that each year of schooling makes to performance in school leaving examination • Italy uses a conversion function based on class size Francis MALHERBE, Eurostat, unit C1 and Alain GALLAIS, OECD, STD/NAFS
Quality indicators (4) The italian model of class size (congestion) Francis MALHERBE, Eurostat, unit C1 and Alain GALLAIS, OECD, STD/NAFS
Quality indicators (5) • The issue of quality is, indeed, a very difficult one, both conceptually and in terms of implementation : • for instance, is it correct to refine the quantity indicator with pupil absence and to adjust on performance in school leaving examination ? • Is not the performance / score when leaving school the „true“ quality of output? (for each pupil counted for one) Francis MALHERBE, Eurostat, unit C1 and Alain GALLAIS, OECD, STD/NAFS
Conclusion (1) • Eurostat is interested to learn the ideas from this workshop. • Eurostat will continue discussions at EU level with MS. • It is important to work on administrative sources, in particular to help to reduce statistical burden. Francis MALHERBE, Eurostat, unit C1 and Alain GALLAIS, OECD, STD/NAFS
Conclusion (2) • The reflexions on spatial comparisons stimulate the ideas for temporal purpose also. • The OECD hopes to have achieved some progress, in partnership with Eurostat, for a further workshop in Paris in June 2007. Francis MALHERBE, Eurostat, unit C1 and Alain GALLAIS, OECD, STD/NAFS