Download
1 / 62
770 likes | 1.56k Views
Recent advances in Magnetic Resonance Imaging. Peter Fransson MR Research Center, Cognitive Neurophysiology Dept. of Clinical Neuroscience, Karolinska Institute. Overview. Brief recap : MRI Physics Image acquisition speed is of essence… Functional Magnetic Resonance Imaging

E N D
Recent advances in Magnetic Resonance Imaging Peter Fransson MR Research Center, Cognitive Neurophysiology Dept. of Clinical Neuroscience, Karolinska Institute
Overview • Brief recap: MRI Physics • Image acquisition speed is of essence… • Functional Magnetic Resonance Imaging • Diffusion tensor MRI, MR tractography • Parallel Magnetic Resonance Imaging • Outlook
Physical principles of NMR (very briefly) Proton spin angular momentum: Magnetic dipole moment: External magnetic field: Energy levels are split (Zeeman effect): E , anti-parallel spin E 0 , parallel spin B0
Physical principles of NMR (very briefly) Motion of spins in an external magnetic field: NMR experiment: static field and radiofrequency (RF) field): In a rotating frame of reference with the angular frequency B0 M0 M y x B1
Spatial localization in MRI • Let the magnetic field vary in x, y and z-space. Gx x
MR IMAGING IN 1973 P.C. Lauterbur, Nature, 242:190-191, 1973
CONVERTING FREQUENCIES INTO SPATIAL LOCATIONS ”k-space” ”reconstructed image” 2D -FFT 0 1 2 2 0 1
TRAVEL IN ”K-SPACE” WITH THE SPIN ECHO SEQUENCE 180 900 3 1 2 3 4 4 1 • The gradients permits sampling of points in k-space. 2 • Each echo gives us one line in k-space. • Scan time: TR x N_phase ECHO
Conventional gradient echo image acquisition RF SIGNAL N excitations / image N times 0.1-0.2 slices / second
Echo Planar Imaging sequence 90o RF TEeff SIGNAL
EPI image acquisition SIGNAL
EPI and T2*-sensitivity 64 echoes or more are acquired per image EPI is strongly sensitive to variabilities in the magnetic field (T2*)
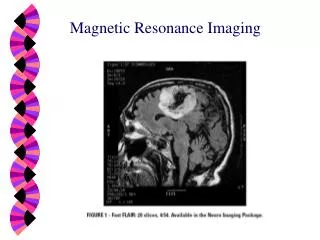
(Gradient) Echo planar imaging T2*-weighted image contrast TR/TE/flip = 3000ms/40ms/90deg 3.4 x 3.4 x 4 mm3, 30 slices
Hypothesis on brain function Paradigm design Physiological and metabolic responses Signal changes in the MR image Post processing / statistical analysis Visualisation / Activation maps
HEMOGLOBIN • 4 subunits, each carrying a heme (red) • one iron atom (Fe2+ ) is carried by each heme • to each heme an oxygen molecule can be attached • with oxygen : oxy-hemoglobin • without oxygen : deoxy-hemoglobin
Oxy-hemoglobin Slightly diamagnetic, same as the surrounding tissue Deoxy-hemoglobin Paramagnetic, susceptibility difference: ppm
The BOLD effect - theoretically Magnetic field distortions: a Outside ”vessel”: r Inside ”vessel”:
Oxygen saturation and magnetic susceptibility Bandettini & Wong, Intern. J. of Imag. Syst. And Techn. 6:133, (1995)
Historical background (II): Initial observations • Ogawa (1990): • Gradient echo imaging (T2*-sensitivity) of mouse brain at 7T • Changed inhalation gas from 100% to 20% oxygen (room air) • Observed a signal decrease in the vicinity of vessels (reversable) • No signal change in corresponding spin echo images (T2-sensitivity) Conclusion: Signal decrease is due to increased magnetic field inhomogeneities caused by an increase in the concentration of paramagnetic deoxy-Hb. Cerebral blood oxygenation (CBO) Signal change in T2*-sensitized MR images BOLD - Blood Oxygenation Level Dependent
rCBF and rCMRO2 mismatch CBF BOLD effect CMRO2 Neuronal activity
fMRI - Blocked design OFF: ON: OFF ON OFF ON OFF ON OFF ON OFF t 0s 30s 60s 90s 120s 150s 180s 210s 240s 270s Continuous EPI image acquisition
fMRI – Blocked design T2*-weightedimage Activation map, p<0.001 • 2T, blipped EPI: TR/TE/flip = 400ms / 54ms / 30 degrees • 10s reversing checkerboard / 20s fixation cross, 6 repetitions • Anatomy: RF-spoiled gradient eko (FLASH) ,TR/TE/flip = 70ms / 6ms / 60 deg.
fMRI Summary • fMRI does not directly measure neuronal activity - it relies on vascular and metabolic correlates of changes in the neuronal work load. • Results are dependent on the design of the experiment and the MR parameter settings. • Large intersubject variability in the resulting activation maps • Only relative changes in brain activity can be measured with BOLD fMRI.
A stationary molecule in the presence of diffusion gradients f ω < ω0 ω > ω0 180
MR signal intensity in spin echo sequences decreases exponentially: D = diffusion coefficient The diffusion coefficient can be determined by measuring the spin-echo amplitude as a function of gradient strength
Introduce diffusion gradients in the imaging sequence G Skiv- sel. d D Freq. Enc. Phase Enc. 180° 90 RF
b vs. signal intensity log (signal) T2-weighting DWI = diffusion weighted image S0 S1 b b0 b1
The ADC image • ADC = Apparent Diffusion Coefficient • ADC = the slope • CSF 2000 m2/s • Brain 700 m2/s
A clinical example of diffusion-weighted MRI: acute stroke Var är infarkten? ADC T2 DWI
Measurement of the Diffusion Tensor DT-MRI Gray matter CSF White matter
Spatial orientation of the diffusion tensor, red=L-R, green=S-I, blue=A-P FA-map (Fractional Anisotrophy)
MR Tractography – Fiber tracking • Following the direction of the eigenvector corresponding to the largest eigenvalue through the imaged brain volume • e.g. to see if/which two brain regions are connected • several fibres in e.g. the brain stem can be identified • Requires high-resolution & high SNR • Scan times minimum ~20 minutes with SS-EPI • Several methods for improve the results based on the still too noisy data • FACT, Spaghetti model, Continuous tensor field Courtesy of Susumu Mori, Johns Hopkins, Baltimore
Acquisition of MR image Sampling of k-space Imaging scan time is determined by the time it takes to sample k-space. Scan time can be reduced by doing tricks in k-space such as • Fractional NEX sampling of k-space (ky range reduced) • Fractional echo sampling of k-space (kx range reduced) But speed in k-space is crucially determined by gradient strength: Only one point in k-space can be sampled at a time!
The measured signal will depend on the distance to the object being imaged. d Receiver coil Object (Biot-Savarts law)
We can receive MR signals from several coils in parallel... An image from each coil can be generated. The signal intensity in each voxel will depend on the spatial distance of that voxel and the coil.