Download
1 / 65
650 likes | 727 Views
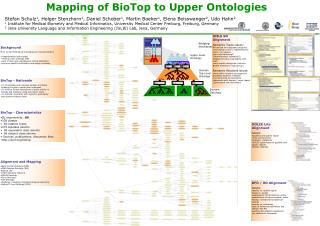
Upper-level Mesoscale Disturbances on the Periphery of Closed Anticyclones. Thomas J. Galarneau, Jr. and Lance F. Bosart University at Albany, State University of New York Albany, NY 12222 USA. Fourth Symposium on Southwest Hydrometeorology 21 September 2007 – Tucson, AZ. Motivation.

E N D
Upper-level Mesoscale Disturbances on the Periphery of Closed Anticyclones Thomas J. Galarneau, Jr. and Lance F. Bosart University at Albany, State University of New York Albany, NY 12222 USA Fourth Symposium on Southwest Hydrometeorology 21 September 2007 – Tucson, AZ
Motivation • Warm season continental closed anticyclones (CAs) link weather and climate on intraseasonal time scales • Can persist for most of 90-day warm season • Surface temperature/rainfall anomalies with CAs can determine overall seasonal anomalies for a given region • High-impact severe weather on CA periphery associated with mesoscale disturbances
Goals • Examine the CA of July 1995 over the US • Impact on rainfall distribution • Behavior of mesoscale disturbances on periphery of CA and their role in MCS development
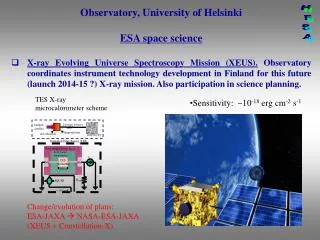
Data and Methods • 2.5 NCEP–NCAR Reanalysis • 1.125 ECMWF Reanalysis (ERA-40) • 0.25 NCEP Unified Precipitation Dataset (UPD) • University of Wyoming sounding archive • National Lightning Detection Network (NLDN) • Dynamic tropopause defined at 1.5 PVU surface
500 hPa Height (dam) Mean and Anomaly and Wind (m/s) Fig. A1 from Galarneau et al. 2007 2.5 NCEP–NCAR Reanalysis ridge building Height Anomaly 5–10 July 1995 Wind eastward progression Height Anomaly 11–15 July 1995 Wind 11-15 Jul 1995 500 hPa HGHT
850 hPa 21C Isotherm Continuity Map 0000 UTC 5–15 July 1995 11 12 10 9 7 8 6 13 14 15 5 2.5 NCEP–NCAR Reanalysis Fig. A5 from Galarneau et al. 2007
00Z/13 +/- DT (K) and wind (knots) X NLDN CG lightning MCS #1 PV tail mesoscale disturbance X X 1.125 ECMWF Reanalysis
12Z/13 +/- X DT (K) and wind (knots) X X X NLDN CG lightning X MCS #1 X X PV tail mesoscale disturbance X X 1.125 ECMWF Reanalysis
00Z/14 +/- X X DT (K) and wind (knots) X X X NLDN CG lightning MCS #2 X MCS #1 X PV tail mesoscale disturbance X X 1.125 ECMWF Reanalysis
12Z/14 +/- X X DT (K) and wind (knots) X X X NLDN CG lightning X X MCS #2 X PV tail mesoscale disturbance X X X 1.125 ECMWF Reanalysis
00Z/15 +/- X DT (K) and wind (knots) X X X X NLDN CG lightning MCS #3 X PV tail X mesoscale disturbance X X 1.125 ECMWF Reanalysis
12Z/15 +/- DT (K) and wind (knots) X X X NLDN CG lightning MCS #3 X PV tail X mesoscale disturbance X X 1.125 ECMWF Reanalysis
Schematic for 13–15 July 1995 L Strong Jet X H X X DT flow mesoscale disturbance source region PV Tail
CG Lightning 12–15 July 1995 +/- 12–13 13–14 14–15 +/- +/- NLDN
Storm Reports 12–15 July 1995 MCS #1 MCS #3 MCS #2 tornado/wind reports near persistent trough tornado wind hail Reports associated with PV tail + Generated using SeverePlot v2.5 Source: Storm Prediction Center
850 e (K), 925–500 wind shear (knots), 850–500 lapse rate (K km-1) 00Z/13–15 July 1995 1.125 ECMWF Reanalysis
850 e (K), 925–500 wind shear (knots), 850–500 lapse rate (K km-1) 00Z/13–15 July 1995 1.125 ECMWF Reanalysis 2300 J kg-1 Univ. Wyoming 00Z/13
850 e (K), 925–500 wind shear (knots), 850–500 lapse rate (K km-1) 00Z/13–15 July 1995 1.125 ECMWF Reanalysis 7000 J kg-1 Univ. Wyoming 00Z/13
850 e (K), 925–500 wind shear (knots), 850–500 lapse rate (K km-1) 1800 J kg-1 Univ. Wyoming 00Z/13–15 July 1995 1.125 ECMWF Reanalysis 00Z/14
% Contribution of JJA to Yearly Precipitation 1948–2003 UPD %
% Contribution of 12–15 Jul to JJA Climo ~25% ~20–30% UPD %
Case Study Summary • Downstream development led to ridge building over the Intermountain West • As CA moved eastward, convection formed on the periphery in association with mesoscale disturbances and a PV tail • Serial severe MCSs formed on poleward side • High CAPE, high shear environment • Scattered convection formed on equatorward side • Moderate CAPE, low-moderate shear environment
Climate Implications • Rainfall • MCSs on periphery contributed ~25% of climatological JJA precipitation • Mesoscale disturbances can produce intense rain events and/or severe weather events • Temperature • Subset of CAs that build over Intermountain West, then move eastward can produce heat waves • Climatologically hot air over Intermountain West must be displaced to “anomalous” regions
Postscript:Upper-level disturbances, PV tails, and tropical systems
DT (K), wind (knots), and 925–850 hPa (10-5 s-1) Low-level Vorticity center 18Z/19
DT (K), wind (knots), and 925–850 hPa (10-5 s-1) Source: NCDC GIBBS GOES-12 PV tail thinning and breaking 00Z/20
DT (K), wind (knots), and 925–850 hPa (10-5 s-1) Source: NCDC GIBBS GOES-12 00Z/21
DT (K), wind (knots), and 925–850 hPa (10-5 s-1) Jerry? 06Z/21
1345Z/21 VIS
1445Z/21 VIS
1545Z/21 VIS
1645Z/21 VIS