Download
1 / 12
120 likes | 210 Views
This study explores methods for detecting congestion in the internet based on packet loss and delay measurements, offering insights for network administrators to manage and mitigate congested segments efficiently. The proposed network tomographic approach uses end-to-end measurements to identify congested areas. By analyzing snapshots and correlations between loss rates and delay variations, the study provides valuable assistance to ISPs in optimizing resource allocation.

E N D
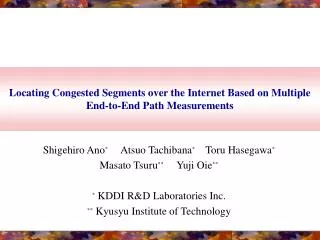
Locating Congested Segments over the Internet Based on Multiple End-to-End Path Measurements Shigehiro Ano*Atsuo Tachibana* Toru Hasegawa* Masato Tsuru** Yuji Oie** * KDDI R&D Laboratories Inc. ** Kyusyu Institute of Technology
Contents • Introduction • Congestion occur in the Internet (social infrastructure) • Inference Methods • Inference by Packet Loss Measurement • Inference by Packet Delay Variation Measurement • Measurement Infrastructure & Conditions • Analysis and results • Measurement Snapshots • Analysis Based on the Internet Location • Correlation between Each Inference Methods (Loss Rate & Delay Variation) • Conclusion
Internet is serving as a communication infrastructure. • But, congestion is very likely to occur in the Internet (best effort). • Network administrator must take actions to mitigate the congestion. • ・route management ・traffic engineering • How can we locate congested segments ? • SNMP • not scalable • networks are operated independently (in the Internet) • Bottleneck identification tool • difficult to use all over the networks continuously due to • extraordinary test packts • We propose • Network tomographic approach based on end-to-end packet loss & delaymeasurement with low rate probing packet Introduction
An Inference Method Using Loss Measurement (1) • Detect path performance degradation • characterize path performance • ・ Yj≧h ⇒ good, • ・ Yj<l ⇒ bad, • ・ otherwise ⇒ medium • Infer bad segments • rule(1)Pi is good but Pj is bad • ⇒ Sj is bad (Xi<h) • if l ≤h2 < h, this rule is held. • rule(2) both Pi and Pjare bad • ⇒ S3 is likely bad (X3 <h) • Assumptions・X1 , X2and X3 are independent. • X1 , X2 and X3 are likely to be good ⇔ bad is uncommon. • X3 (along P1 ) and X’3 (along P2 ) are nearly same. Yj :non-loss rate onPj Xi : non-loss rate onSi We adopt 0.99 and 0.995 as l and h.
Rule(2) Rule(1) An Inference Method Using Loss Measurement (2) An example of the path topology mapping table
An Inference Method Using Delay Measurement (1) • Procedure • Assign each monitored path to its own specific cluster • Calculate the distance for each pair of two different paths • Merge the closest pair of clusters • Calculate the distance between the new merged cluster and each of the old cluster Adopt Ward’s Method[1] • Repeat (3) and (4) until all paths are clustered into a single cluster • Determine a partition by cutting the dendrogram recursively • Infer bad segments using rule (2) of the inference method using loss measurement 10ms is the threshold to detect congestion. OK heavy congestion may hide mild congestion⇒ Recursive Cutting OK congested paths 0 non-congested path congested paths [1] Ward, J. H, "Hierarchical Grouping to Optimize an Objective Function." Journal of the American Statistical Association, 58, pp. 236-244, 1963.
d(wk)= An Inference Method Using Delay Measurement (2) Define “distance” based on the non-similarity of the time series of packet delay variation Utilizing TWD (Time Warping Distance)[2] - TWD tries to find the optimal alignment between two time series the sum of differences resulting from the alignment is minimized. the larger difference between the two packet delay variations pi and qj pseudo packet pair
Measurement Infrastructure & Conditions Location B Location A about 1000 km • Subscribing to 3 ISP networks via FTTH access NW (max.100Mbps) at each location • Measure non-loss packet rate every 15 second and 99%tile of delay variation every 5 second actively on 30 paths. • Test packets: 64byte UDP, uniformed distributed interval: 10-90ms (about 10Kbps) • traceroute is issued every 1 minute
The paths’ states that are classified into the same cluster are synchronized Result (1) Loss Rate & Delay Variation Snapshots Loss Rate Snapshot from ISP1 at Location A to ISP2 at Location B packet loss rate Our method infer S1 is bad. S2 and S5 does not become bad simultaneously. Delay Variation Snapshot Dealy Variation (ms) about 90% (67202 / 73622 periods) of the clustering results were consistent with route information
Result (2) Analysis Based on Location delay variation loss rate Congestion tends to occur on specific segments The total number of 5-second periods in which 5 segments are congested represents about 81% of the total number of congested results ⇒Our method should be assistance to ISPs by helping them to allocate their investment resources efficiently
Result(3) Correlation Between the Inference Results Based on Loss Rate and Delay Variation • Inference based on loss rate • congested segment: packet loss rate > 0.01 • measurement period: 15 second • Comparison • We chose a path on which segments are inferred by both methods frequently. • To compare simply, we summarized both results every minute. Inference Results over One Minute Periods Both results are the same in 84% of the periods of simultaneous inference
Conclusion ■Method of locating congested segments by actively measuring end-to-end packet loss rate & delay variations on multiple paths - based on a network tomographic approach & clustering technique - allows us to find multiple deteriorated segments even when multiple congestion occurs at different places on either the same path or different respective paths. ■Measurement on 30 paths for 10 weeks - about 90% of the clustering results were consistent with route information