Download
1 / 32
330 likes | 472 Views
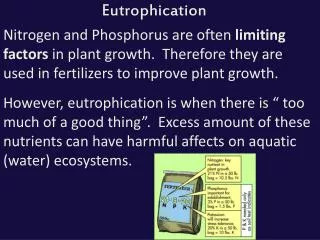
Eutrophication 4 Assessing , Monitoring and Remediation. Alice Newton. Assessing Eutrophication. Monitoring EU trophication, EEA. · nutrients : TP (year round and winter), PO4 (winter), TN (year round and winter), NO3 (winter), NO2 (winter), NO3+ NO2 (winter), NH4 (winter),

E N D
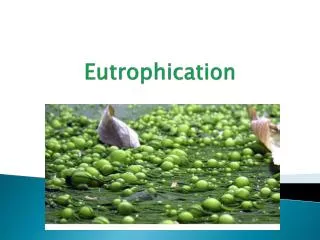
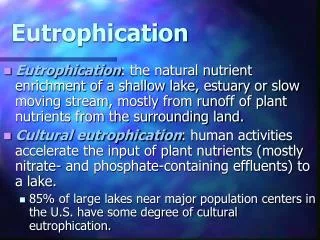
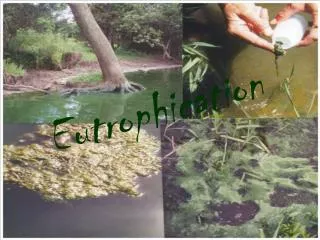
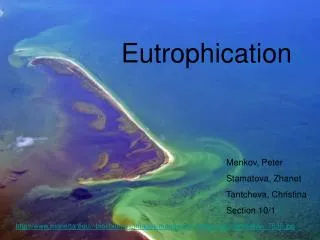
Eutrophication 4Assessing, Monitoring and Remediation Alice Newton
Monitoring EUtrophication, EEA • · nutrients: TP (year round and winter), PO4 (winter), TN (year round and winter), NO3 (winter), NO2 (winter), NO3+ NO2 (winter), NH4 (winter), • TN/TP (year round) and SiO3 (winter); • watershed input: TN, TP and TC entering the water system. • · oxygen level: dissolved oxygen concentration or saturation in bottom water layer; • · transparency: Secchi depths (summer); • · phytoplankton: algal blooms, toxic algae, Phaeocystis sp., diatom/flagellate ratio (spring and summer) and chlorophyll-a (summer); • · benthic vegetation: seagrasses (cover and maximum depth occurrence) and seaweeds (cover and maximum depth occurrence); micro-phytobenthos biomass; • · benthic fauna: macro-zoobenthos biomass;
EU • 1980’s Environmental Legislation and Directives • Nitrate Directive, • Urban Waste Water Directive, • Drinking Water Directive
Assessment of Impact of EU Directives on P • Phosphorus concentrations in severely affected lakes have decreasedsignificantly • Phosphorus concentrations in major rivers have decreasedsignificantly over the last 15 years • No clear trend in coastal waters • Directive: The Urban Waste Water • Action: investment by EEA member countries in nutrient removal
Assessment of Impact of EU Directives on N • Nitrogen pollution has been reduced to a far lesser extent • Nitrogen surplus from agriculture at the same concentration as in 1990 • Nitrate concentrations have remained constant and high. • Nitrate concentrations in many groundwater supplies exceed limits set by the Drinking Water Directive.
EEA assessment of Nutrients and Eutrophication • Late 1990’s • Little or No improvement in N despite Nitrate Directive • Need for more comprehensive Environmental legislation • Water Framework Directive, WFD
2000 WFD Water Framework Directive • CIS Common Implementation Strategy • Guidance documents • GIG Geographical Intercalibration Groups e.g. Portugal and Norway belong to NEA North East Atlantic
DPSIR assessment framework for eutrophication in coastal EU waters
USA National Estuaries Assessment…different approach • Eutrophication Severity and Extent • Symptoms of Eutrophication in Estuaries • Human Influence on Eutrophication • Impaired Uses of Estuaries • Potential Management Concerns • Future Eutrophic Conditions, 2020 • Data Gaps and Research Needs • National Strategy
Simplified Eutrofication Model of NEEA Now updated through ASSETS (Compare these to Cloern)
Severity and Extent • High eutrophic conditions: • 44 estuaries, • 40% of the total estuarine surface area studied. • …Where? • all coasts • most prevalent in • Gulf of Mexico • Middle Atlantic coasts • Moderate conditions : • 40 estuaries • 25 % of the total estuarine surface area studied.
Matrix for Determining Level of Eutrophication NEEA
Symptoms of Eutrophication in Estuaries • 82 estuaries • 67% of estuarine surface area • moderate to high expressions of the following symptoms: • depleted dissolved oxygen, • loss of submerged vegetation, • and nuisance/toxic algal blooms.
Eutrophication and Nutrient Inputs • 44 Estuaries have high levels of eutrophication • Few, 6 /44, have high level N inputs. • Half, 22 / 44, have moderate-level N inputs.
A high level of human influence in 36/44 estuaries with high eutrophic conditions. Human Influence on Eutrophication
Estuarine export potential and susceptibility • 25/ 44 estuaries have a high susceptibility to retaining nutrients. • Important observation… according to these results, the physical characteristics of the estuary are often more important than nutrient inputs!
Susceptibility Additional factors may influence susceptibility of a system to eutrophication e.g.: • Tidal flushing and dilution • Light regime • Zooplankton grazing • Benthic suspension feeders • Climate change
Impaired Uses of Estuaries • 69 estuaries have human-use impairments related to eutrophication. • Commercial/recreational fishing and shellfisheries most frequently affected in 43 and 46 estuaries, respectively.
Potential Management Concerns • 23 estuaries require greater management effort and longer time, ~ 10% of the estuarine surface area. • 10 estuaries should be priorities for preventive management, ~ 3% of the estuarine surface area. • Typical point and nonpoint pollution sources identified as important to target in order to manage nutrient problems.
Future of Eutrophication USA (2020) • Most likely worsen in 86 estuaries by the year 2020. • Of the 86 estuaries expected to worsen, 43 exhibit only low to moderate eutrophic conditions. • 10 estuaries that exhibit low eutrophic conditions and have high susceptibility are most at risk of future degradation if human-related nutrient inputs increase.
Data Gaps and Research Needs • Information and knowledge is still inadequate in 48 estuaries • Research to clarify thelinkages between eutrophication and impacts on estuarine resources: • fisheries, • recreation and tourism • risks to human health. • Adequately characterize and quantify nutrient pressure on estuaries: • total nutrient inputs • inputs by source • estimators of nutrient pressure (e.g., population, land use). • Atmospheric and groundwater inputs are least well quantified. • Better characterization of physical factors, including: • basic circulation patterns, • effects of weather patterns, • climate change, • changing land use, • resultant effects on nutrient delivery, • circulation, and eutrophic conditions. • Defining the relationship between nutrient inputs and toxic blooms • Characterization of assimilative capacity • Characterization of the effects of seasonal population changes.
National USA Strategy • Continue Assessment • Implement Management • Continue Monitoring • Prevention • Research • Integrate with regional, state, and local programs… But then, there was a change of administration!
Remediation • Sewage treatment (with biological nutrient removal). Smart septic tanks • Restoring wetlands and riperian vegetation • Reduction of nonpoint sources of N & P • Efficient and intelligent use of fertilizer inc. timed application & sub soil delivery • Treatment of animal wastes and utilization of manure as fertilizer • Decrease animal protein diet demand • Controls on vehicles and industrial atmospheric outputs • Nutrient trading…although CO2 trading has NOT been a success home.cc.umanitoba.ca/~vsmil
Total phosphorus discharges from urban wastewater treatment plants in north-west European countries have fallen 50-80 % during the past 15 years. The main reason for this reduction is the upgrading of wastewater treatment plants to include phosphorus removal. The shift to phosphate-free detergents has also contributed. Discharge of P from water treatment in NW EU. EEA
Nordic and central European countries have the highest percentage of wastewater subject to tertiary treatment (particularly phosphorus removal) Impact of Urban Watewater treatment. EEA