Dynamics and Vertical Structure of Drylines in the Central Great Plains: Insights from Aircraft Observations
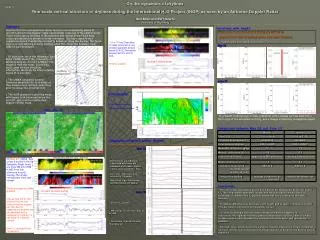
This study examines the dynamics and fine-scale vertical structure of drylines in the central Great Plains using aircraft and airborne Doppler radar observations. Focused on late morning to early evening conditions, we analyze the convective boundary layer development and the impact of drylines on initiating severe thunderstorms. Key findings include variations in theta-v gradients and moisture ratios across drylines observed on two different case days—May 22 and June 19—highlighting the influence of solenoidal circulation and density currents on dryline characteristics.

Dynamics and Vertical Structure of Drylines in the Central Great Plains: Insights from Aircraft Observations
E N D
Presentation Transcript
Flight level eastern dryline western dryline western dryline EAST WEST dry side is less dense (warmer) P2R.3 Summary Variations with height Dryline structure and dynamical characteristics are examined by means of aircraft and airborne Doppler radar observations collected in the central Great Plains in late spring. Drylines in the southern and central Great Plains have received considerable attention in the literature. One key reason is that sometimes severe thunderstorms tend to break out along the dryline. The focus here is on late morning to early evening, when the convective boundary layer (CBL) is well-developed. solenoidal tilt Differences of variables across dryline are defined as: [mean of 3 km east of dryline] – [mean 3 km west of dryline] June 19 has Clear skies, no deep convection in any direction apparent, at least before 20:30 Z. The dryline progresses from west to east. Small θv gradient • Lighter colors correspond to later times. solenoidal circulation May 22 • Of particular use is the Wyoming Cloud Radar (WCR) aboard the University of Wyoming King Air aircraft (UWKA). The reason is that the radar, in profiling mode, gives vertical structure information, which can be interpreted by means of in situ data. • The UWKA conducted several traverses perpendicular to drylines as they became more defined, sometimes prior to convective initiation (CI). • The WCR operated in profiling mode, with beams both below and above the aircraft, and in vertical-plane dual-Doppler (VPDD) mode. On the dynamics of drylinesFine-scale vertical structure of drylines during the International H2O Project (IHOP) as seen by an Airborne Doppler RadarQun Miao and Bart GeertsUniversity of Wyoming June 19 Dual-Doppler Note sloping boundary and solenoidal circulation SPOL May 22 • θv gradient reverses sign in time, consistent with a change vertical echo tilt, a flip in sign of the solenoidal vorticity, and a change in boundary propagation speed. ground level Comparison between May 22 and June 19 Composite variations across dryline • Different variables are averaged in 200-m bins across the dryline for 9 cases on May 22 and 7 cases on June 19. May 22 21:50 UTC 00:12 UTC On May 22, UWKA flew across a dryline in the OK Panhandle. Flight levels are from 150 m to 1500 m AGL from late afternoon to early evening. The dryline retrogresses from east to west. Obvious mixing ratio (MR) gradient The vertical tilt of the dryline fine-line, the vertical velocity couplet, and the density temperature gradient are all consistent with a solenoidal circulation, i.e. the basis of a density current. Note: qv’ is proportional to buoyancy solenoidal tilt Dotted lines are individual cases and bold lines are averages of all cases. Lighter colors correspond later times. Zm: close-flight-level mean reflectivity (14 gates) Wm: close-flight-level mean vertical velocity (14 gates) solenoidal circulation Conclusions • The echo plume and updraft plume at the dryline tilt towards the denser air (lower θv). The tilted updraft/downdraft couplet and the convergent flow are part of a solenoidal circulation. The θv gradient shows that this circulation is thermally directed. • On May 22, MR difference decreases with height and so does θv difference as well. This decrease is consistent with a density current. • On June 19, strongly confluent flow (synoptically driven) happens to • concentrate the regional moisture gradient and produce a dryline. Later in the day, surface sensible heating makes the cooler western side hotter and reverse the θv gradient. • Although large-scale convergence and the regional slope of the terrain is important, on much smaller scales, the dryline definition appears to be driven by density current dynamics. June 19 • Gentle θv gradient. • MR change is less than May 22 as well. • Confluence is much stronger than May 22.