Download
1 / 89
890 likes | 902 Views
This lecture covers the concepts of hypothesis testing and multivariate methods in statistical inference for particle physics. Topics include probability, parameter estimation, building statistical models, hypothesis tests, and more.

E N D
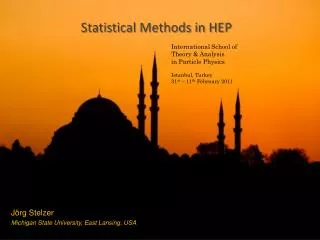
Statistical Methods for Particle PhysicsLecture 2: hypothesis tests I; multivariate methods https://indico.weizmann.ac.il//conferenceDisplay.py?confId=52 Statistical Inference for Astro and Particle Physics Workshop Weizmann Institute, Rehovot March 8-12, 2015 Glen Cowan Physics Department Royal Holloway, University of London g.cowan@rhul.ac.uk www.pp.rhul.ac.uk/~cowan Weizmann Statistics Workshop, 2015 / GDC Lecture 2 TexPoint fonts used in EMF. Read the TexPoint manual before you delete this box.: AAAA
Outline for Monday – Thursday (GC = Glen Cowan, KC = Kyle Cranmer) Monday 9 March GC: probability, random variables and related quantities KC: parameter estimation, bias, variance, max likelihood Tuesday 10 March KC: building statistical models, nuisance parameters GC: hypothesis tests I, p-values, multivariate methods Wednesday 11 March KC: hypothesis tests 2, composite hyp., Wilks’, Wald’s thm. GC: asympotics 1, Asimov data set, sensitivity Thursday 12 March: KC: confidence intervals, asymptotics 2 GC: unfolding Weizmann Statistics Workshop, 2015 / GDC Lecture 2
Hypotheses A hypothesisH specifies the probability for the data, i.e., the outcome of the observation, here symbolically: x. x could be uni-/multivariate, continuous or discrete. E.g. write x ~ f (x|H). x could represent e.g. observation of a single particle, a single event, or an entire “experiment”. Possible values of x form the sample space S (or “data space”). Simple (or “point”) hypothesis: f (x|H) completely specified. Composite hypothesis: H contains unspecified parameter(s). The probability for x given H is also called the likelihood of the hypothesis, written L(x|H). Weizmann Statistics Workshop, 2015 / GDC Lecture 2
Definition of a test Goal is to make some statement based on the observed data x as to the validity of the possible hypotheses. Consider e.g. a simple hypothesis H0 and alternative H1. A test of H0 is defined by specifying a critical region Wof the data space such that there is no more than some (small) probability a, assuming H0 is correct, to observe the data there, i.e., P(x W | H0 ) ≤ a If x is observed in the critical region, reject H0. a is called the size or significance level of the test. Critical region also called “rejection” region; complement is acceptance region. Weizmann Statistics Workshop, 2015 / GDC Lecture 2
Definition of a test (2) But in general there are an infinite number of possible critical regions that give the same significance level a. So the choice of the critical region for a test of H0 needs to take into account the alternative hypothesis H1. Roughly speaking, place the critical region where there is a low probability to be found ifH0 is true, but high if H1 is true: Weizmann Statistics Workshop, 2015 / GDC Lecture 2
Rejecting a hypothesis Note that rejecting H0 is not necessarily equivalent to the statement that we believe it is false and H1 true. In frequentist statistics only associate probability with outcomes of repeatable observations (the data). In Bayesian statistics, probability of the hypothesis (degree of belief) would be found using Bayes’ theorem: which depends on the prior probability p(H). What makes a frequentist test useful is that we can compute the probability to accept/reject a hypothesis assuming that it is true, or assuming some alternative is true. Weizmann Statistics Workshop, 2015 / GDC Lecture 2
Type-I, Type-II errors Rejecting the hypothesis H0 when it is true is a Type-I error. The maximum probability for this is the size of the test: P(x W | H0 ) ≤ a But we might also accept H0 when it is false, and an alternative H1 is true. This is called a Type-II error, and occurs with probability P(x S -W | H1 ) = b One minus this is called the power of the test with respect to the alternative H1: Power = 1 -b Weizmann Statistics Workshop, 2015 / GDC Lecture 2
Choosing a critical region To construct a test of a hypothesis H0, we can ask what are the relevant alternatives for which one would like to have a high power. Maximize power wrt H1 = maximize probability to reject H0 if H1 is true. Often such a test has a high power not only with respect to a specific point alternative but for a class of alternatives. E.g., using a measurement x ~ Gauss (μ, σ) we may test H0 : μ= μ0 versus the composite alternative H1 : μ> μ0 We get the highest power with respect to any μ> μ0 by taking the critical region x ≥ xc where the cut-off xc is determined by the significance level such that α = P(x ≥xc|μ0). Weizmann Statistics Workshop, 2015 / GDC Lecture 2
Τest of μ = μ0vs. μ > μ0with x ~ Gauss(μ,σ) Standard Gaussian cumulative distribution Standard Gaussian quantile Weizmann Statistics Workshop, 2015 / GDC Lecture 2
Choice of critical region based on power (3) But we might consider μ< μ0 as well as μ> μ0 to be viable alternatives, and choose the critical region to contain both high and low x (a two-sided test). New critical region now gives reasonable power for μ< μ0, but less power for μ> μ0 than the original one-sided test. Weizmann Statistics Workshop, 2015 / GDC Lecture 2
No such thing as a model-independent test In general we cannot find a single critical region that gives the maximum power for all possible alternatives (no “Uniformly Most Powerful” test). In HEP we often try to construct a test of H0 : Standard Model (or “background only”, etc.) such that we have a well specified “false discovery rate”, α = Probability to reject H0 if it is true, and high power with respect to some interesting alternative, H1 : SUSY, Z′, etc. But there is no such thing as a “model independent” test. Any statistical test will inevitably have high power with respect to some alternatives and less power with respect to others. Weizmann Statistics Workshop, 2015 / GDC Lecture 2
p-values for a set of Suppose hypothesis H predicts pdf observations We observe a single point in this space: What can we say about the validity of H in light of the data? Express level of compatibility by giving the p-value for H: p = probability, under assumption of H, to observe data with equal or lesser compatibility with H relative to the data we got. This is not the probability that H is true! Requires one to say what part of data space constitutes lesser compatibility with H than the observed data (implicitly this means that region gives better agreement with some alternative). Weizmann Statistics Workshop, 2015 / GDC Lecture 2
Significance from p-value Often define significance Z as the number of standard deviations that a Gaussian variable would fluctuate in one direction to give the same p-value. 1 - TMath::Freq TMath::NormQuantile E.g. Z = 5 (a “5 sigma effect”) corresponds to p = 2.9 × 10⁻⁷. Weizmann Statistics Workshop, 2015 / GDC Lecture 2
Using a p-value to define test of H0 One can show the distribution of the p-value of H, under assumption of H, is uniform in [0,1]. So the probability to find the p-value of H0, p0, less than a is We can define the critical region of a test of H0 with size a as the set of data space where p0≤ a. Formally the p-value relates only to H0, but the resulting test will have a given power with respect to a given alternative H1. Weizmann Statistics Workshop, 2015 / GDC Lecture 2
The Poisson counting experiment Suppose we do a counting experiment and observe n events. Events could be from signal process or from background – we only count the total number. Poisson model: s = mean (i.e., expected) # of signal events b = mean # of background events Goal is to make inference about s, e.g., test s = 0 (rejecting H0 ≈ “discovery of signal process”) test all non-zero s (values not rejected = confidence interval) In both cases need to ask what is relevant alternative hypothesis. Weizmann Statistics Workshop, 2015 / GDC Lecture 2
Poisson counting experiment: discovery p-value Suppose b = 0.5 (known), and we observe nobs = 5. Should we claim evidence for a new discovery? Give p-value for hypothesis s = 0: Weizmann Statistics Workshop, 2015 / GDC Lecture 2
Poisson counting experiment: discovery significance Equivalent significance for p = 1.7 × 10⁻⁴: Often claim discovery if Z > 5 (p < 2.9 × 10⁻⁷, i.e., a “5-sigma effect”) In fact this tradition should be revisited: p-value intended to quantify probability of a signal-like fluctuation assuming background only; not intended to cover, e.g., hidden systematics, plausibility signal model, compatibility of data with signal, “look-elsewhere effect” (~multiple testing), etc. Weizmann Statistics Workshop, 2015 / GDC Lecture 2
Example setting for statistical tests: the Large Hadron Collider Counter-rotating proton beams in 27 km circumference ring pp centre-of-mass energy 14 TeV Detectors at 4 pp collision points: ATLAS CMS LHCb (b physics) ALICE (heavy ion physics) general purpose Weizmann Statistics Workshop, 2015 / GDC Lecture 2
The ATLAS detector 2100 physicists 37 countries 167 universities/labs 25 m diameter 46 m length 7000 tonnes ~108 electronic channels Weizmann Statistics Workshop, 2015 / GDC Lecture 2
A simulated SUSY event high pT jets of hadrons high pT muons p p missing transverse energy Weizmann Statistics Workshop, 2015 / GDC Lecture 2
Background events This event from Standard Model ttbar production also has high pT jets and muons, and some missing transverse energy. → can easily mimic a SUSY event. Weizmann Statistics Workshop, 2015 / GDC Lecture 2
Physics context of a statistical test Event Selection: the event types in question are both known to exist. Example: separation of different particle types (electron vs muon) or known event types (ttbar vs QCD multijet). E.g. test H0 : event is background vs. H1 : event is signal. Use selected events for further study. Search for New Physics: the null hypothesis is H0 : all events correspond to Standard Model (background only), and the alternative is H1 : events include a type whose existence is not yet established (signal plus background) Many subtle issues here, mainly related to the high standard of proof required to establish presence of a new phenomenon. The optimal statistical test for a search is closely related to that used for event selection. Aachen 2014 / Statistics for Particle Physics, Lecture 2
Statistical tests for event selection Suppose the result of a measurement for an individual event is a collection of numbers x1 = number of muons, x2 = mean pT of jets, x3 = missing energy, ... follows some n-dimensional joint pdf, which depends on the type of event produced, i.e., was it For each reaction we consider we will have a hypothesis for the pdf of , e.g., etc. E.g. call H0 the background hypothesis (the event type we want to reject); H1 is signal hypothesis (the type we want). Weizmann Statistics Workshop, 2015 / GDC Lecture 2
Selecting events Suppose we have a data sample with two kinds of events, corresponding to hypotheses H0 and H1 and we want to select those of type H1. Each event is a point in space. What ‘decision boundary’ should we use to accept/reject events as belonging to event types H0 or H1? H0 Perhaps select events with ‘cuts’: H1 accept Weizmann Statistics Workshop, 2015 / GDC Lecture 2
Other ways to select events Or maybe use some other sort of decision boundary: linear or nonlinear H0 H0 H1 H1 accept accept How can we do this in an ‘optimal’ way? Weizmann Statistics Workshop, 2015 / GDC Lecture 2
Test statistics The boundary of the critical region for an n-dimensional data space x = (x1,..., xn) can be defined by an equation of the form where t(x1,…, xn) is a scalar test statistic. We can work out the pdfs Decision boundary is now a single ‘cut’ on t, defining the critical region. So for an n-dimensional problem we have a corresponding 1-d problem. Weizmann Statistics Workshop, 2015 / GDC Lecture 2
Test statistic based on likelihood ratio How can we choose a test’s critical region in an ‘optimal way’? Neyman-Pearson lemma states: To get the highest power for a given significance level in a test of H0, (background) versus H1, (signal) the critical region should have inside the region, and ≤ c outside, where c is a constant chosen to give a test of the desired size. Equivalently, optimal scalar test statistic is N.B. any monotonic function of this is leads to the same test. Weizmann Statistics Workshop, 2015 / GDC Lecture 2
Classification viewed as a statistical test Probability to reject H0 if true (type I error): α = size of test, significance level, false discovery rate Probability to accept H0 if H1 true (type II error): β = power of test with respect to H1 Equivalently if e.g. H0 = background, H1 = signal, use efficiencies: Weizmann Statistics Workshop, 2015 / GDC Lecture 2
Purity / misclassification rate Consider the probability that an event of signal (s) type classified correctly (i.e., the event selection purity), Use Bayes’ theorem: prior probability Here W is signal region posterior probability = signal purity = 1 – signal misclassification rate Note purity depends on the prior probability for an event to be signal or background as well as on s/b efficiencies. Weizmann Statistics Workshop, 2015 / GDC Lecture 2
Neyman-Pearson doesn’t usually help We usually don’t have explicit formulae for the pdfs f(x|s), f(x|b), so for a given x we can’t evaluate the likelihood ratio Instead we may have Monte Carlo models for signal and background processes, so we can produce simulated data: generate x ~ f(x|s) → x1,..., xN generate x ~ f(x|b) → x1,..., xN This gives samples of “training data” with events of known type. Can be expensive (1 fully simulated LHC event ~ 1 CPU minute). Weizmann Statistics Workshop, 2015 / GDC Lecture 2
Approximate LR from histograms Want t(x) = f(x|s)/f(x|b) for x here One possibility is to generate MC data and construct histograms for both signal and background. Use (normalized) histogram values to approximate LR: N(x|s) N(x|s) ≈ f(x|s) x N(x|b) N(x|b) ≈ f(x|b) Can work well for single variable. x Weizmann Statistics Workshop, 2015 / GDC Lecture 2
Approximate LR from 2D-histograms Suppose problem has 2 variables. Try using 2-D histograms: back- ground signal Approximate pdfs using N(x,y|s), N(x,y|b) in corresponding cells. But if we want M bins for each variable, then in n-dimensions we have Mn cells; can’t generate enough training data to populate. →Histogram method usually not usable for n > 1 dimension. Weizmann Statistics Workshop, 2015 / GDC Lecture 2
Strategies for multivariate analysis Neyman-Pearson lemma gives optimal answer, but cannot be used directly, because we usually don’t have f(x|s), f(x|b). Histogram method with M bins for n variables requires that we estimate Mn parameters (the values of the pdfs in each cell), so this is rarely practical. A compromise solution is to assume a certain functional form for the test statistic t(x) with fewer parameters; determine them (using MC) to give best separation between signal and background. Alternatively, try to estimate the probability densities f(x|s) and f(x|b) (with something better than histograms) and use the estimated pdfs to construct an approximate likelihood ratio. Weizmann Statistics Workshop, 2015 / GDC Lecture 2
Multivariate methods Many new (and some old) methods: Fisher discriminant Neural networks Kernel density methods Support Vector Machines Decision trees Boosting Bagging New software for HEP, e.g., TMVA , Höcker, Stelzer, Tegenfeldt, Voss, Voss, physics/0703039 StatPatternRecognition, I. Narsky, physics/0507143 Weizmann Statistics Workshop, 2015 / GDC Lecture 2
Resources on multivariate methods C.M. Bishop, Pattern Recognition and Machine Learning, Springer, 2006 T. Hastie, R. Tibshirani, J. Friedman, The Elements of Statistical Learning, 2nd ed., Springer, 2009 R. Duda, P. Hart, D. Stork, Pattern Classification, 2nd ed., Wiley, 2001 A. Webb, Statistical Pattern Recognition, 2nd ed., Wiley, 2002. Ilya Narsky and Frank C. Porter, Statistical Analysis Techniques in Particle Physics, Wiley, 2014. 朱永生(编著),实验数据多元统计分析,科学出版社,北京,2009。 Weizmann Statistics Workshop, 2015 / GDC Lecture 2
Linear test statistic Suppose there are n input variables: x = (x1,..., xn). Consider a linear function: For a given choice of the coefficients w = (w1,..., wn) we will get pdfs f(y|s) and f(y|b) : Weizmann Statistics Workshop, 2015 / GDC Lecture 2
Linear test statistic Fisher: to get large difference between means and small widths for f(y|s) and f(y|b), maximize the difference squared of the expectation values divided by the sum of the variances: Setting ∂J/∂wi = 0 gives: , Weizmann Statistics Workshop, 2015 / GDC Lecture 2
The Fisher discriminant The resulting coefficients wi define a Fisher discriminant. Coefficients defined up to multiplicative constant; can also add arbitrary offset, i.e., usually define test statistic as Boundaries of the test’s critical region are surfaces of constant y(x), here linear (hyperplanes): Weizmann Statistics Workshop, 2015 / GDC Lecture 2
Fisher discriminant for Gaussian data Suppose the pdfs of the input variables, f(x|s) and f(x|b), are both multivariate Gaussians with same covariance but different means: f(x|s) = Gauss(μs, V) Same covariance Vij = cov[xi, xj] f(x|b) = Gauss(μb, V) In this case it can be shown that the Fisher discriminant is i.e., it is a monotonic function of the likelihood ratio and thus leads to the same critical region. So in this case the Fisher discriminant provides an optimal statistical test. Weizmann Statistics Workshop, 2015 / GDC Lecture 2
The activation function For activation function h(·) often use logistic sigmoid: Weizmann Statistics Workshop, 2015 / GDC Lecture 2