Download
1 / 43
430 likes | 460 Views
This text delves into region segmentation using K-Means algorithm, clustering based on color, intensity clusters, finding optimal K value, and split and merge techniques. Moreover, it discusses graph theory concepts for image segmentation like graph representations, minimum cut, and normalized cuts.

E N D
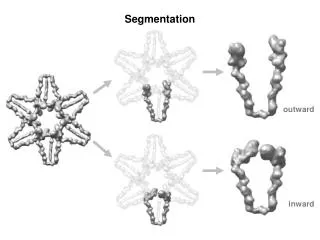
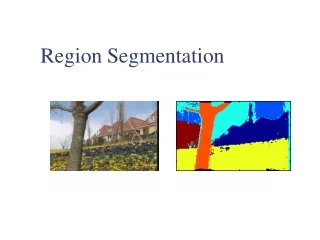
Region Segmentation • Find sets of pixels, such that • All pixels in region i satisfy some constraint of similarity.
Choose a fixed number of clusters Choose cluster centers and point-cluster allocations to minimize error can’t do this by search, because there are too many possible allocations. Algorithm fix cluster centers; allocate points to closest cluster fix allocation; compute best cluster centers x could be any set of features for which we can compute a distance (careful about scaling) K-Means
Image Segmentation by K-Means • Select a value of K • Select a feature vector for every pixel (color, texture, position, or combination of these etc.) • Define a similarity measure between feature vectors (Usually Euclidean Distance). • Apply K-Means Algorithm. • Apply Connected Components Algorithm. • Merge any components of size less than some threshold to an adjacent component that is most similar to it.
Image Clusters on intensity Clusters on color K-means clustering using intensity alone and color alone
Image Clusters on color K-means using color alone, 11 segments
K-means using color alone, 11 segments.
K-means using colour and position, 20 segments
How to find K • Use prior knowledge about image. • Apply the algorithm for different values of K and test for goodness of clusters. • Analyze Image Histograms.
How to Find K Realistic Histograms
How to Find K Smooth Histogram. (Convolve by averaging or Gaussian Filter)
How to Find K Find Peaks and Valleys and perform peakiness test.
Assume that each cluster is single pixel (i.e. every pixel is a cluster itself). Merge Clusters i.e. attach closest to cluster it is closest to (if possible) Repeat step 2 until no more clusters can be merged. Agglomerative clustering
Assume that whole image is a single cluster. Split Clusters along best boundary (if exists) Repeat step 2 until no more clusters can be split. Divisive clustering
single-link clustering: Minimum distance between an element of the first cluster and one of the second.. complete-link clustering: Maximum distance between an element of the first cluster and one of the second. group-average clustering: Average of distances between elements in the clusters. Inter-Cluster distance
Start with an initial segmentation (for example by K-Means). Define a criteria P for goodness of region such that P( R )=True, if R satisfies the criteria P( R )=False, otherwise For each region R, split R in four regions (quadrants), if P( R ) = False Merge any two adjacent regions R and Qif Repeat until no more clusters can be split or merged. Segmentation by Split and Merge
Graph • A graph G(V,E) is a triple consisting of a vertex set V(G) an edge set E(G) and a relation that associates with each edge two vertices called its end points.
Path • A path is a sequence of edges e1, e2, e3, … en. Such that each (for each i>2 & i<n) edge ei is adjacent to e(i+1) and e(i-1). e1 is only adjacent to e2 and en is only adjacent to e(n-1)
Connected & Disconnected Graph • A graph G is connected if there is a path from every vertex to every other vertex in G. • A graph G that is not connected is called disconnected graph.
Graphs Representations a b c e d Adjacency Matrix: W
Weighted Graphs and Their Representations a b c e 6 d Weight Matrix: W
Minimum Cut A cut of a graph G is the set of edges S such that removal of S from G disconnects G. Minimum cut is the cut of minimum weight, where weight of cut <A,B> is given as
Image Segmentation & Minimum Cut Pixel Neighborhood w Image Pixels Similarity Measure Minimum Cut
Minimum Cut • There can be more than one minimum cut in a given graph • All minimum cuts of a graph can be found in polynomial time1. 1H. Nagamochi, K. Nishimura and T. Ibaraki, “Computing all small cuts in an undirected network. SIAM J. Discrete Math. 10 (1997) 469-481.
Drawbacks of Minimum Cut • Weight of cut is directly proportional to the number of edges in the cut. Cuts with lesser weight than the ideal cut Ideal Cut
Normalized Cuts1 • Normalized cut is defined as • Ncut(A,B) is the measure of dissimilarity of sets A and B. • Minimizing Ncut(A,B) maximizes a measure of similarity within the sets A and B 1J. Shi and J. Malik, “Normalized Cuts & Image Segmentation,” IEEE Trans. of PAMI, Aug 2000.
Finding Minimum Normalized-Cut • Finding the Minimum Normalized-Cut is NP-Hard. • Polynomial Approximations are generally used for segmentation
Finding Minimum Normalized-Cut Pixel Neighborhood 1 2 3 w Image Pixels Similarity Measure n n-1
Finding Minimum Normalized-Cut • It can be shown that such that • If y is allowed to take real values then the minimization can be done by solving the generalized eigenvalue system
Algorithm • Compute matrices W & D • Solve for eigen vectors with the smallest eigen values • Use the eigen vector with second smallest eigen value to bipartition the graph • Recursively partition the segmented parts if necessary.
Figure from “Image and video segmentation: the normalised cut framework”, by Shi and Malik, 1998
F igure from “Normalized cuts and image segmentation,” Shi and Malik, 2000
Drawbacks of Minimum Normalized Cut • Huge Storage Requirement and time complexity • Bias towards partitioning into equal segments • Have problems with textured backgrounds
Suggested Reading • Chapter 14, David A. Forsyth and Jean Ponce, “Computer Vision: A Modern Approach”. • Jianbo Shi, Jitendra Malik, “Normalized Cuts and Image Segmentation,” IEEE Transactions on Pattern Analysis and Machine Intelligence, 1997 • Chapter 3, Mubarak Shah, “Fundamentals of Computer Vision”