Download
1 / 13
140 likes | 212 Views
Explore key concepts like GDP, GNP, and PPP while discussing issues with data accuracy and welfare measurement alternatives. Learn about sustainable economic growth and the Misery Index. Evaluate living standards across countries and consider the factors influencing economic welfare.

E N D
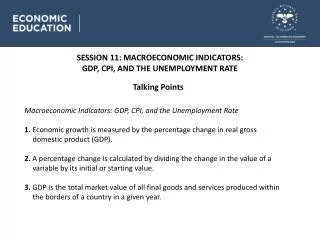
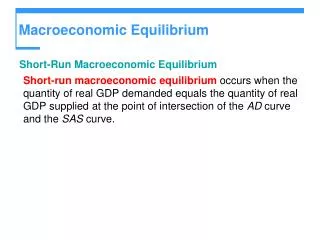
Macroeconomic Indicators Uses of National Income Data
Terms - explain • Gross Domestic Product (GDP) • Gross National Product (GNP) • National Income (NI) • Non-monetised sector • Purchasing Power Parity (PPP) • Human Development Index (HDI) • Human Poverty Index (HPI) • Measure of Domestic Progress (MDP) • Misery Index
Problems with the data • GDP does not fully measure output • Non-monetised sector • Unpaid labour • DIY • Parenting • ‘black’ economy • GDP does not account for quality
BBC-B Computer £400 (£1200) I-pad £329
Problem with the data • Distribution of income • Value of Leisure • Externalities • What is produced • Defence or consumer goods? • Differences between countries • PPP • How accurately is the data collected?
Alternatives in measuring welfare(you need to know at least one of these!) • HDI • Standard of living (GDP per capita) • Life expectancy at birth, in years • Educational attainment (literacy and enrolment) • Maximum value =1, the closer the better. • Use ‘The Economist in Figures’ to research countries which differ in ‘performance’ • Can you explain why they differ?
Alternatives in measuring welfare • HPI • Longevity • Knowledge • Economic provision • Social inclusion
Alternatives in measuring welfare • MDP • Social and environmental cost of growth • Crime • Family breakdown • Benefits of unpaid work • household labour
Alternatives in measuring welfare • Misery Index • Adding the unemployment rate to the rate of inflation • High unemployment and high inflation = higher economic and social costs
Sustainable Economic Growth • You need to know the issues • Resource depletion • Market mechanism • Higher prices • Greater efficiency in use • Greater supply (cost effective to research) • Investment in substitutes • Environmental damage • Global warming • Koyoto Protocol 1997; World Summit 2015 • Developing countries exempt (China, India, USA!)
Index of Sustainable Economic Welfare • ISEW = personal consumption+ public non-defensive expenditures- private defensive expenditures+ capital formation+ services from domestic labour- costs of environmental degradation- depreciation of natural capital
A recent EU survey reported that income per head was significantly lower in Greece and Portugal than in the Netherlands and Ireland. Evaluate the view that living standards must therefore be higher than those in Greece and Portugal (25 marks)