Download

1 / 18
180 likes | 264 Views
Addressing current energy challenges through smart controls and on-site generation for efficiency, reliability, and emissions reduction. Learn about the latest trends driving the future of energy management.

E N D
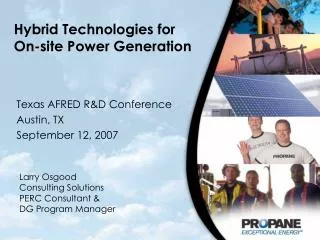
Integrating smart controls and clean on-site generation Ritchie Priddy Attainment Technologies Emissions Solutions for Today
Smart energy management – getting there from here • Hybrid model of regulation • Instability in producing regions • More emphasis on energy independence &management • Reserves being written down • Drilling? • Volatile fuel prices • Risk increasingly moving to end-users • More environmental restrictions • Little infrastructure investment • No energy policy – problems ignored don’t go away! Only way to meet future needs under present constraints is through smart energy management!
Conservation Cost Savings Reliability Emissions Efficiency Security Shrinking supplies Congestion management Innovative rates T&D deferment Demand response National policy Technology Smart controls Liability Smart energy management drivers Old drivers + New drivers =Future • Smart Grid(automation; controls, demand response) • Efficiency Gains (increased load factors) • Clear Skies • (emissions trading) Risk Management!
Council of Insurance Agents & Brokers rate survey 2nd Qtr 2002 Rate Increases By Line of Business No Change Up 1-10% 10-20% 20-30% 30-50% 50%-100% >100% Comm. Auto 2% 6% 28% 39% 21% 1% 1% Workers Comp 5% 13% 19% 32% 15% 5% 2% General Liability 2% 9% 24% 45% 15% 2% 1% Comm. Umbrella 2% 4% 10% 20% 27% 17% 16% Comm. Property* 3% 4% 16% 30% 31% 13% 1% Business Interr. 3% 8% 32% 33% 10% 1% 0% First quarter after 9/11! No terrorism backup yet. Source: Council of Insurance Agents & Brokers.
Council of Insurance Agents & Brokers rate survey, 3rd qtr 2003 Rate increases by line of business Down 1-10% No Change Up 1-10% 10-20% 20-30% 30-50% 50%-100% Comm. Auto 12% 14% 42% 30% 0% 0% 0% Workers Comp 10% 17% 31% 21% 8% 2% 2% General Liability 9% 21% 39% 24% 4% 1% 1% Comm. Umbrella 6% 17% 27% 33% 11% 4% 0% Comm. Property* 24% 26% 28% 9% 2% 1% 0% Terrorism* 6% 48% 15% 5% 1% 1% 0% Business Interr. 11% 33% 34% 8% 2% 0% 0% Surety Bonds 28% 18% 9% 9% 4% 2% 0% Rates are event-driven! Source: Council of Insurance Agents & Brokers.
On-site generation: a new model? Business Continuity Whole System Approach Risk Management Role Traditional Approach DER Backup Generation/Emergency Traditional DG Time
Room for improvement? US establishments participating in energy management activity, 1998* Not Participating Participating % Energy Audits 202,475 24,338 10.7 Electricity Load Control 205,891 20,922 9.2 Special Rate Schedule 206,500 20,313 9.0 Standby Generation Program 220,531 6,282 2.8 Equipment Rebates 221,952 4,861 2.1 Power Factor Correction 207,272 19,541 8.6 Full Time Energy Manager 224,568 2,245 1.0 * EIA, manufacturing only
Number of establishments by usage of general energy-saving technologies, 1998* Computer control of building-wide environment #s In use % Not in use Plastics and Rubber Products 11,944 1,278 10.7 9,849 Machinery 19,577 1,780 9.1 16,298 Food 16,553 1,349 8.1 13,627 Printing and Related Support 25,782 1,900 7.4 20,170 Miscellaneous 13,630 773 5.7 11,205 Nonmetallic Mineral Products 11,333 643 5.7 9,925 Fabricated Metal Products 40,743 2,083 5.1 35,434 Furniture and Related Products 11,274 389 3.5 9,852 Apparel 12,566 400 3.2 8,629 Wood Products 11,663 284 2.4 10,199 Total: Top 10 Sectors 175,065 10,879 6.2 145,188 * EIA Source: Cambridge Energy Research Associates, Energy Information Administration.
SampleReal-time pricing/nominations to come?Customer Load Profile(with +/- 10% swing) 1 0 0 9 0 8 0 7 0 6 0 k W 5 0 D e m a n d 4 0 3 0 2 0 1 0 A O u t o f r a n g e ; p e n a l t i e s i n c u r r e d 0 0 : 0 5 2 : 3 5 5 : 0 5 7 : 3 5 1 0 : 0 5 1 2 : 3 5 1 5 : 0 5 1 7 : 3 5 2 0 : 0 5 2 3 : 3 5 P e a k d a y u s a g e O u t o f r a n g e ; B a n d w i d t h . p e n a l t i e s i n c u r r e d S a f e r a n g e ; n o p e n a l t i e s P l u s 1 0 % A v e r a g e w e e k d a y u s a g e M i n u s 1 0 % v e r a g e w e e k e n d u s a g e T i m e o f D a y Source: CERA
Effective energy management strategy: using DG to keep usage within limits 5 0 G e n e r a t o r i s s t a r t e d b y t h e E E M a n d f o l l o w s t h e l o a d , k e e p i n g t h e c u s t o m e r w i t h i n b a n d w i d t h . T h i s w i l l k e e p t h e c u s t o m e r f r o m i n c u r r i n g p e n a l t i e s . 4 5 5 0 k W g e n e r a t o r 4 0 t u r n e d o n w h e n l o a d r e a c h e s p r e - 3 5 d e t e r m i n e d p o i n t . B a n d w i d t h . 3 0 a v e r a g e w e e k d a y u s a g e . k W 2 5 D e m a n d P l u s t o l e r a n c e 2 0 M i n u s t o l e r a n c e 1 5 1 0 5 0 0 : 0 5 2 : 4 5 5 : 2 5 7 : 2 5 1 0 : 0 5 1 2 : 4 5 1 5 : 2 5 1 7 : 2 5 2 0 : 0 5 2 3 : 3 5 T i m e o f D a y Source: CERA
Principal AT markets • Congestion relief (demand response) • Short term needs evidenced by expanding programs • Wholesale – PJM, NYISO, NE-ISO, others • Retail – Utility programs, CSP • Solution – Clean, low cost Distributed Generation and CHP Packages • Emissions reduction credits • ERCs bring costs down, and can provide revenue stream • More trading programs established; more liquidity evolving
Demand response can offer more! • According to FERC, Demand Response programs could save the U.S. economy $7.5 billion annually. • Peak Load Management Alliance states that in addition to the savings above, Demand Response programs could provide: • Market efficiency (supply = demand) • Risk management (more control over costs for end-users) • Market mitigation (keeps peak prices lower) • Environmental benefits (reduces need to run dirty plants) • Deferred or avoided T&D upgrades (could be least-cost solution)
DFW-related congestion costs • The DFW area (eight counties) identified as the number one congested area; • Annual Congestion costs> $82 million/yr • Load continues to grow about 5% per year • Current Load in 4-county metro* area: 15,068 MW (’02) • Current Generation in 4-county metro area: 5,800 MW (’02) • Shortfall: 9,268 MW (made up by importing power) • Additional generation plants built & planned in 8-county area: ~ 5,700 MW (all located outside congestion area) • Additional transmission lines planned • ERCOT planners considering a NODAL (or locational pricing) plan that many believe will significantly increase power prices in the region. * 4-county Metro area includes: Collin, Dallas, Denton and Tarrant Counties
DFW environmental issues • The four-county Metro area is a non-attainment area for ground-level ozone. • The EPA State Implementation Plan (SIP) and Senate Bill 7 mandated specific actions to reduce NOx emissions from various sources by 2003, with additional reductions required by 2005. • This requires generation plants in the metro area to either retrofit with new NOx reduction devices, OR to limit operation. “ . . The metro region could experience significant problems of peak period transmission adequacy and voltage stability if a significant amount of in-region generation becomes unavailable and no new in- region plants or transmission system improvements are built.”
NYC power needs by 2008 Electric Resources Net Need (2003-2008) Source: New York City Energy Policy: An Electricity Resource Roadmap. Jan. 2004 Summary of Distributed Resources Potential (2003-2008)
NYC clean dg possibilities ^ Spark-ignited engines ** Emergency Compression Engines installed prior to 1/1/09 ^^ Existing Non-Emergency Diesel-fired engines What if . . . Summary of NYC Distributed Resources Potential 2003-2008
Ritchie Priddy Business Development Director Attainment Technologies, LLC Phone: 337-380-5383 Rpriddy@attainmenttech.com www.attainmenttech.com Contact information