Download
1 / 40
400 likes | 583 Views
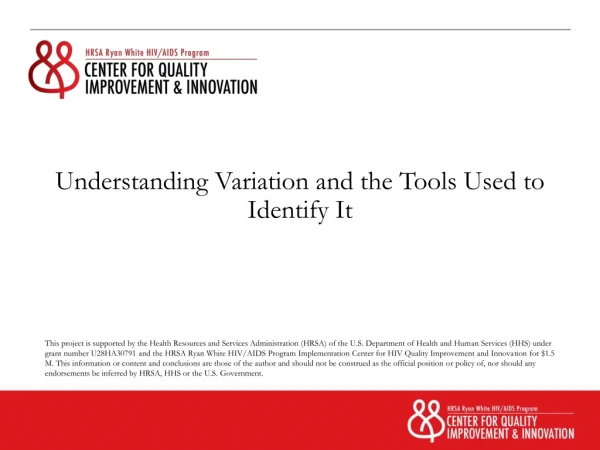
Understanding Variation and the Tools Used to Identify It.

E N D
Understanding Variation and the Tools Used to Identify It This project is supported by the Health Resources and Services Administration (HRSA) of the U.S. Department of Health and Human Services (HHS) under grant number U28HA30791 and the HRSA Ryan White HIV/AIDS Program Implementation Center for HIV Quality Improvement and Innovation for $1.5 M. This information or content and conclusions are those of the author and should not be construed as the official position or policy of, nor should any endorsements be inferred by HRSA, HHS or the U.S. Government.
Learning Objectives • Impart a basic understanding of the two types of variation • How variation affects quality improvement as defined by PCN 15-02 • Basic understanding of control charts and their construction • How to find hidden special cause variation in your data • How variation may hinder your improvement efforts
Introduction This webinar is divided into two parts to illustrate the concepts of variation and its application. The idea of variation arose from probability interpretations discussed as early as 1703 by Gottfried Leibniz. It was Walter Shewhart who used statistics to examine variations in manufacturing data. His observations led to the discovery that processes display variation, some variation is controlled (common cause) and some is uncontrolled (special cause). https://history-biography.com/walter-a-shewhart/
Why Understanding Variation Is Important • Quality improvement is defined in PCN 15-02 (revised 11/30/2018) • PCN 15-02 states that “Quality improvement entails the development and implementation of activities to make changes to the program in response to the performance data results.”1 1 https://hab.hrsa.gov/sites/default/files/hab/Global/CQM-PCN-15-02.pdf
Why Understanding Variation Is Important If you do not interpret your data correctly, it can lead to problems • Fluctuations in data measured over time may or may not indicate a problem in a system • Not all fluctuation in a system is bad • The behavior of a system can be influenced by factors external to the system
How Variation Can Effect Improvement • Reliable, validated data is the key to meaningful improvement • Variation is best determined by rigorous analysis of your data • Variation can effect the system in either a positive or negative way • To learn more about these tools and others, go to ASQ.org or contact CQII for help and guidance
Understanding VariationYour Drive to Work • Your drive to work takes you anywhere between 30-40 minutes (28m if you hit the lights just right) • Some days there seems to be more traffic than others and that slows you down. • Think of your drive as a process with some mild variation • You can reasonably predict the outcome of your commute • Its impossible for you to predict the volume of traffic on the road on a given day • To effectively measure variation, it should be measured and graphed over time
Understanding VariationYour Drive to Work • Think of your drive as a process with some mild variation • You can reasonably predict the outcome of your commute • Its impossible for you to predict the volume of traffic on the road on a given day • To effectively measure variation, it should be measured and graphed over time
What’s Going On in Our Example The system we just discussed – our commute – displays common cause variation. But why? • Common cause variations are the normal variations that occur in a system. In our example, the traffic volume creates a normal variation in arrival time • The outcome is predictable (30 – 40 minutes) • This noise can lead to producing undesirable results even though we say the system is stable http://qualityamerica.com/LSS-Knowledge-Center/statisticalprocesscontrol/statistical_process_control_defined.php
Common Cause Variation Let’s look at the idea of a stable system • A stable system means that the variation in our processes - the noise - is within the limits of acceptable variation • This doesn’t infer that the system is performing well • There are opportunities to improve the system by eliminating the noise • http://qualityamerica.com/LSS-Knowledge-Center/statisticalprocesscontrol/statistical_process_control_defined.php
Understanding VariationYour Journey Continues You start your commute as you do any other day, but then: • A water line ruptures and you now have to detour • It takes you 75 minutes to get to work and the repair is going to take four weeks to complete. • The detours will also change over the course of the four weeks.
Special Cause Variation Because of the construction on our trip, our time went from 30 – 40 minutes to over an hour every day. This is a special cause variation because: • The delay in our trip was caused by something not part of our normal trip • The time of our trip is now unpredictable due to changing routes • Special cause variations can have either a favorable or unfavorable effect on a process • The effect of an occurrence outside of the normal variation within a system was so severe it created a drastic change from our commute
Special Cause Variation • Special cause variations arise from specific circumstances • They may be part of a process but are caused by events not part of a process (remember the water main break) • Special cause variations can be identified and possibly fixed
Identifying Variation Through Charting • A run chart can be useful to determine variation and goal • We need a data set that with at least 15 - 20 data points measured over time • We need as complete a data set as possible • We need to set our goals for ideal and acceptable performance • The following example does not have the same statistical rigor as a control chart
Summary • Variation can be either good or bad; its important to determine the type of variation you have in your system • Special cause variation is external to the system but effects it; the effect can be either good or bad • In healthcare, it is at times best to establish your own upper and lower limits to understand the behavior of your process or system • To use a more structured approach to variation, we need to use a control chart
Introduction This section explains the control chart and its usefulness in examining special cause variation • Offers a quantifiable result to establish special cause variation • It shows if a process is in statistical (measurable) control
Introduction “Walter Andrew Shewhart…was an American physicist, engineer and statistician, sometimes known as the father of statistical quality control. “ W. Edwards Deming said of him: “As a statistician, he was, like so many of the rest of us, self-taught, on a good background of physics and mathematics.” Deming, W. Edwards (1967). "Walter A. Shewhart, 1891-1967". The American Statistician. 21 (2): 39–40. Journal of Storage 1401495
Statistical Control • Shewhart advanced the idea of statistical control; an analysis of data points that when graphed, show how a process “behaves” • To determine statistical control, we need a run chart with: • A central line to determine trends over time (a mean or median) • An upper and lower limit (the acceptable +/- 3 standard deviations of the expected value) • At least 15 - 20 data points are plotted • These additional elements turn a run chart into a control chart
Control Charts • Control charts – also called process behavior charts2 – reflect the performance of a process over time • They can be used to predict performance based on prior behavior • They are a necessity in determining variations in a process or system 2 Wheeler, D.J., (2000). ‘Understanding Variation; the Key to Managing Chaos’. SPC Press (Rev.ed.), Knoxville, TN, p. 153
Control Charts Upper control limit mean Each patient’s wait time
Control Charts In our prior example, we saw that: • The mean and upper and lower control limits were established mathematically • No data points were outside the control limits; our process is said to be in statistical control
Statistical Control But suppose our chart looked like this This is an example of special cause variation. Why?
Statistical Control • The example on the previous slide is an example of special cause variation • In the example we can see that: • A few points are outside the lower and upper control limits • Our results vary widely indicating noise even in data points that are with in the control limits
Evolution of the Control Chart • Over time, guidelines have been put forth by statisticians to help consistently interpret the charts:3 • A point on a limit is not considered outside the limit • A point on the center line is not included in a run; a ‘run’ being consecutive points such as 6 or above • Ties between 2 consecutive points do not add to or cancel a trend • When there is no limit on one side of the center line (such as a result which yields 100%) you do not apply any of the rules to the side missing the limit • These assist in further analyzing the data and pointing out trends that may lead to special cause variation 3Porvost, L., Murray, S., (2011). ‘The Health Care Data Guide’; Josey-Bass, San Francisco, CA; pp. 116-117
Rules for Identifying Special Cause Variation There is special cause variation when: • There is a single point outside the control limit • There is a run of eight or more points in a row above or below the centerline • There are six consecutive points increasing (trending up) or decreasing (trending down) • There are two out of three consecutive points near (outer one third) a control limit • There are 15 consecutive points close (inner one-third of the chart) to the centerline
Rule One When a single point is outside the control limits there is a special cause variation
Rule Two A run of eight or more points in a row above or below the center line defines special cause variation Example of Rule Two
Rule Three Six consecutive points increasing or decreasing define a special cause variation minutes
Rule Four Two out of three consecutive points near the outer one third of a control limit define a special cause variation Near the outer one-third of he center line minutes
Rule Five Fifteen consecutive points close (inner one third) to the centerline constitute a special cause variation Inner 1/3 of the center line minutes
Summary of Five Rules • These rules are derived over time to further identify special cause variation • Data must be carefully plotted for these patterns to become evident • These five rules can be used in improvement projects to spur further investigation or to judge the effectiveness of your improvement activities
Can Control Charts Be Used in Healthcare? One study applied control charts to examine clinical variables in four common medical conditions and concluded they have a promising role but need more rigorous evaluation4 4R. Tennant, M. Mohammed, J. Coleman, U. Martin (2007). “Monitoring patients using control charts: a systematic review”. International Journal for Quality in Health Care. http://dx.doi.org/10.1093/intqhc/mzm015 First published online: 1 June 2007, pp.187-194
Can Control Charts Be Used in Healthcare? When you want to determine what type of control chart to use (run chart with goals or a control chart) remember this: • Let common sense prevail; you cannot have more than 100% of something or less than zero • Control charts follow precise mathematics • Remember the five rules and look for the patterns within the data
Summary • The idea of variation was based on earlier works far back as the 1700s • Processes have inherent variations categorized as common cause and special cause variation • Run charts are an effective way of determining variation • Special cause variation can be present in a system and following the guidelines for run charts and analyzing variation will help identify variations • Deeper analysis of your data leads to a better understanding of what may need to be improved
Resources • Wheeler, D., (2000). Understanding Variation; The Key to managing Chaos (2nd edition). Knoxville, TN. SPC Press. • Provost, L., Murray, S. (2011). The Health Care Data Guide; Learning From Data for Improvement. San Francisco, CA. Jossey-Bass • Knowledge Center. http://qualityamerica.com/LSS-Knowledge-Center/statisticalprocesscontrol/statistical_process_control_defined.php • R. Tennant, M. Mohammed, J. Coleman, U. Martin (2007). “Monitoring patients using control charts: a systematic review”. International Journal for Quality in Health Care. http://dx.doi.org/10.1093/intqhc/mzm015 First published online: 1 June 2007, pp. 187-194
To hear the recording, go tohttps://meetny.webex.com/meetny/lsr.php?RCID=57f9eeb9bc7c488896d0d05c53401d52