Case Studies of Batch Processing Experiments
Case Studies of Batch Processing Experiments. Diane K. Michelson International Sematech Statistical Methods. May 21, 2003 Quality and Productivity Research Conference. Abstract. Experimentation in the semiconductor industry requires clever design and clever analysis.


Case Studies of Batch Processing Experiments
E N D
Presentation Transcript
Case Studies of Batch Processing Experiments Diane K. Michelson International Sematech Statistical Methods May 21, 2003 Quality and Productivity Research Conference
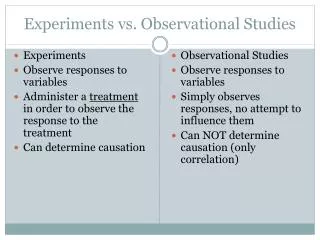
Abstract • Experimentation in the semiconductor industry requires clever design and clever analysis. • In this paper, we look at two recent experiments performed at ISMT. • The first is a split plot design at a clean operation. • The second is a strip plot design of 3 factors over 3 process steps. • The importance of using the correct error terms in testing the model will be discussed. 2
A B C D -1 -1 -1 -1 -1 -1 -1 +1 -1 -1 +1 -1 -1 -1 +1 +1 -1 +1 -1 -1 -1 +1 -1 +1 -1 +1 +1 -1 -1 +1 +1 +1 +1 -1 -1 -1 +1 -1 -1 +1 +1 -1 +1 -1 +1 -1 +1 +1 +1 +1 -1 -1 +1 +1 -1 +1 +1 +1 +1 -1 +1 +1 +1 +1 Split Plot Experiment • An experiment was designed to optimize the performance of a wafer cleaning step. • Factors were chemical supplier and three process factors (time, temp, concentration). • A 24 full factorial (plus centerpoints) was first considered. Run 1 Run 2 Run 3 Run 4 Run 5 Run 6 Run 7 Run 8 Run 9 Run 10 Run 11 Run 12 Run 13 Run 14 Run 15 Run 16 3
Completely Randomized Design • In the CRD, treatments are randomly assigned to experimental units. • The CRD would require 16 bath changes, one for each run. • This was not practical, since bath changes are expensive and time-consuming. • Engineering wanted to run all treatment combinations using one supplier first in one bath, and all treatment combinations using the second supplier in another bath. 4
What Engineering Wanted A -1 A +1 RUN 10 RUN 11 RUN 12 RUN 13 RUN 14 RUN 15 RUN 16 RUN 9 RUN 1 RUN 2 RUN 3 RUN 4 RUN 5 RUN 6 RUN 7 RUN 8 -1 +1 -1 +1 -1 -1 +1 +1 B -1 -1 +1 +1 -1 +1 +1 -1 C -1 -1 -1 -1 +1 +1 +1 +1 D 1 2 3 4 5 7 8 6 5
Multiple experimental units • The split plot design has two (or more) experimental units. • The experimental unit for the supplier variable is a bath (whole plot). • The experimental unit for the process factors is a wafer (sub plot). • Note that supplier is not a blocking factor. 6
B=+1,C=+1 B=-1,C=+1 B=+1,C=+1 B=+1,C=-1 B=+1,C=-1 B=-1,C=-1 B=-1,C=+1 B=-1,C=-1 B=+1,C=+1 B=-1,C=+1 B=-1,C=+1 B=-1,C=-1 B=+1,C=+1 B=+1,C=-1 B=+1,C=-1 B=-1,C=-1 A=+1 A=-1 Visual Look 7
Analysis • The model is • Parameter estimates are not affected by the split plot design • The error term for testing effects is not necessarily the residual, since there are restrictions on randomization. 8
ANOVA • The ANOVA table for an unreplicated split plot design shows that with just one “run” of each supplier, the supplier effect can not be tested. 9
A A -1 +1 -1 +1 -1 +1 -1 +1 -1 +1 B -1 -1 +1 +1 -1 +1 +1 -1 C -1 -1 -1 -1 +1 +1 +1 +1 D 1 2 3 4 5 7 8 6 Replicated Whole Plots 10
ANOVA for replicated whole plots • Replicating the supplier once gives this ANOVA table. 11
A cheaper option A A -1 +1 2 1 • Another choice is to run a fractional factorial within each supplier run. • Statistical software will not create this design, in general. • It is typically easier to create these designs “by hand” in a spreadsheet package. 3 4 -1 +1 -1 +1 -1 -1 +1 +1 B -1 -1 +1 +1 -1 +1 +1 -1 C -1 -1 -1 -1 +1 +1 +1 +1 D 12
ANOVA for fractioned design • ANOVA table for the fractioned design. Note the decrease in residual df. • Adding 2 centerpoints per supplier run will add 4 df to the residual and allows for a test of curvature of the process factors. 13
Considerations • CRD • very expensive, since one factor is hard to vary • Split plot • cheaper, but not as much information on the supplier effect as on the process effects • must have replicates of whole plot factor 14
Strip plot experiment • Problem: yield issues on Interconnect baseline product • Product is a short loop process of Metal 1, Via, Metal 2 • The failing electrical parameter was Via chain yield • Yield was fine after M2 but bad after Final Test 15
Via chains • Each measurement represents the resistance of a via chain as measured by forcing a current through the 360,000 via chain, and sensing a voltage. • This generates a resistance value for the chain, which is divided by 360,000 to get the per-via resistance. • The responses were yield and medianresistance of a via in a chain of 360,000 vias. Yield was defined using a 1 ohm criterion for the .25m via diameter. 17
Design • Three factors, each at 2 levels, plus centerpoints 23 full factorial. • If run as a Completely Randomized Design, this experiment would use 10 wafers, and 10 runs. • Wafers are not batched. 20
Design • Engineering wanted to batch wafers together at each step. • Using just 10 wafers would mean 3 runs of each tool, one for each level of the factor. • This leads to 0 error df, and untestable effects. • Need to have multiple runs at each level. 21
Design • This design is a strip plot. • Wafers are batched. • Requires 20 wafers in 2 lots of 10, but only 6 runs of each tool. 22
Visual Look B=+1 B=-1 A=+1 A=-1 A=-1 A=+1 B=+1 B=-1 23
Analysis • The model is • The strip plot design does not change effect calculations. 24
Testing effects • In the CRD, the denominator of the F-statistic for testing the main effects and two factor interactions is the residual. • In the Strip Plot, there are restrictions on randomization, therefore, the error term for testing effects is not necessarily the residual. 25
Testing effects • The error term for testing all the effects at one process step is the LOT*EFFECT interaction. • The error term for testing effects which cross process steps is the residual. 26
Considerations • CRD • more runs • less wafers • wafers should not be batched together • textbook analysis • Strip plot • less runs • more wafers • wafers can be batched • more complex analysis • Analyzing a strip plot as a CRD may lead to missing significant effects. 27
General considerations • What about single wafer tools? • Each wafer is a separate run. • If the only thing defining a batch is the wafer handling, treat it as a single wafer tool. • If the chamber needs to heat up or otherwise change before a batch is run, treat it as a batch tool. • What about estimating variability from the past? • R&D Engineers are looking for very large effects. • they want to see these effects each and every time a process is run. • What do you do when Things Go Horribly Wrong? • graphs… 28
Conclusions • Experimentation in the wafer fab requires consideration of • design structure • execution structure • Experiments with hard-to-vary factors are good candidates for split plot designs • Experiments which cover multiple process steps are good candidates for strip plot designs 29