Download
1 / 21
210 likes | 230 Views
Explore water efficiency, productivity, and footprints in agriculture for sustainable practices. Includes data on Spain's water usage patterns and policy implications. Learn about the integration of economic, hydrological, and ecological aspects in water management.

E N D
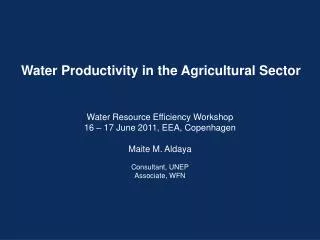
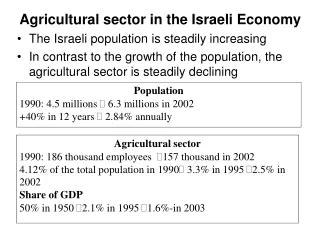
Water Productivity in the Agricultural Sector Water Resource Efficiency Workshop 16 – 17 June 2011, EEA, Copenhagen Maite M. Aldaya Consultant, UNEP Associate, WFN
Green water ► volume of rainwater stored in the soil Blue water ► volume of fresh surface or groundwater
Producing more goods and services using less water… Water efficiency The accomplishment of a function, task, process, or result with the minimal amount of water feasible (m3/product units) Water productivity Ratio of the volume of benefit, i.e. output, service or satisfaction to the amount of water used in the production process (product units/m3)
The water footprint concept ►The WF is an indicator of water use that looks at both direct and indirect water use of a consumer or producer. ►Water use is measured in terms of: - water volumes consumed (evaporated or otherwise not returned) - polluted per unit of time ►Geographically explicit ► A WF can be calculated for: - process - product - consumer - group of consumers (e.g. municipality, province, state, nation) - producer (e.g. a public organization, private enterprise) [Hoekstra et al., 2011]
National water accounting framework Internal water footprint External water footprint WF of national consumpt. = + + + + Water use for export Virtual water import for re-export Virtual water export = + = = = WF within nation Virtual water import Virtual water budget + = Consumption Export Production Import Traditional statistics on water use (withdrawals)
Water footprint of Spain • Distinctiveaspects: • Integration of hydrological, ecological and economicaspects • Socio-political and institutional drivers pending • Participation of thestakeholders-farmers. WIN-WIN solution • In Spainthepolicy of ‘more crops and jobs per drop’ • has tochangeto • ‘more cash and care of nature per drop’ • Isthisfeasible?
Water footprint of Spain Agricultural Urban Industrial 7% 9% 84% 4% 99% 96% Water footprint of Spain (46 Km3) (2004) Internal WF (inside Spain) 13 Km3 (28%) External WF (in other countries) 33 Km3 (72%) 1% Source: based on Garrido et al. (2010)
Water productivity in agriculture (Spain) Water apparent productivity and blue and green water footprint of crop production in Spanish agriculture (2002) Source: Garrido et al. (2010)
Water productivity in agriculture (Spain) • Most blue water irrigation in Spain is used for low value crops: • 10% of the blue water (mainly groundwater) produces 80% of the economic value of irrigated agriculture • 80% of the blue water produces low value crops Total water use in agriculture by crop productivity range as percent of volume and value added (2001-2002) Source: Aldaya et al. (2008)
Water footprint of Spain • Livestock economic relevance has increased during the last decade; • Most livestock is exported (mainly pork) while grown with imported fodder (virtual water); • Increased water dependency. Crop-related virtual water imports by country of origin Source: Garrido et al. (2010)
Food (virtual water) trade drivers • Virtual watertrademitigatesdroughtcycles (acts as a counter-cyclicaleffect) • Virtual watertradeismainly a consequence of agricultural (crop and livestock) policies: • boostswater and landproductivity • favoursspecialisation and efficiency • permits more efficient use of availablegreenwater • Enables a closerconnection of water uses in thebasinwith global water use
Decoupling economic growth from water use Water footprint and virtual watertrade per grossdomesticproduct Source: Garrido et al. (2010)
Water footprint of Spain CUENCA TOLEDO CÁCERES 835 1286 142 93 905 745 CIUDAD REAL UPPER GUADIANA BADAJOZ ALBACETE MIDDLE GUADIANA 3 10 21 CÓRDOBA LOWER GUADIANA HUELVA PROVINCES GREEN WATER 34 UPPER GUADIANA BLUE SURFACE WATER 74 SEVILLA MIDDLE GUADIANA BLUE GROUNDWATER 43 LOWER GUADIANA FORMER LOWER GUADIANA II OR TOP DOMAIN TOP DOMAIN 0 25 50 100 150 200 Km Source: Aldaya and Llamas (2008) WF Guadiana river basin - green and blue (surface and groundwater) - related economic analysis Spanish regulation (2008) requires including the WF analysis in the River Basin Management Plans according to the EU WFD.
Water footprint in Spain Incorporating the Water Footprint and Environmental Water Requirements into policy: Reflections from Doñana Region (Spain) (Aldaya et al., 2010)
Water footprint of Spain • Water footprint into policy • Spain is the first country that has included a water footprint analysis into governmental policy making in the context of the EU Water Framework Directive (WFD) (2000/60/EC). • In 2008 the Spanish Government approved a regulation requiring the water footprint analysis for the development of the River Basin Management Plans according to the EU WFD (BOE, 2008). • Recently Spanish regulation about sustainable tourism mentions the water footprint (Plan FuturE 2010) (BOE, 2010)
Water footprint of Spain Conclusions 1. The WF is a goodmethodfor IWRM, butneedsfurtherrefinements 2. Thefood (virtual water) tradeisusuallydrivenbycomparativeadvantages. Therelativescarcity of watermaynotbe a relevant driver. 3. Socio-politicalfactors in watermanagementmightbe as important as theenvironmental and economicones. Anequilibriumbetweenutilitarian and intangible valuesisnecessary. 4. Spanish situation suggests that it is time to change (in industrialized and emerging countries) from a policy of ‘more crops per drop’ to a policy of ‘more cash and care of nature per drop’
Conclusions Producing more goods and services….. ….with less water .…with less impact
Conclusions Water efficiency and productivity - Framework to inform and support decision-making - Inform water allocation decisions - Awareness raising - Promote product transparency - Eco-efficiency (operational and supply chain) - Benchmarking Challenges - Database improvement (industrial blue water consumption) - Uncertainties (data used and accounts) - Communication (volumes and impacts) - Governance (good governance structure for implementation) - Water-pricing policies (incentives for efficient water use, role CAP)
Thanks! • OBSERVATORIO DEL AGUA • WATER OBSERVATORY