Download
1 / 14
140 likes | 161 Views
This study explores a method for delineating areas of possible gopher tortoise habitat using soil, landcover, and topographic data. The model identifies prime and marginal habitat areas, providing valuable information for conservation and transportation planning.

E N D
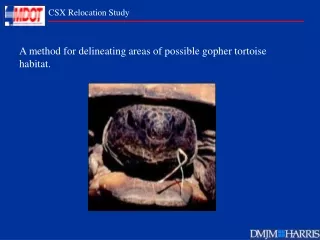
A method for delineating areas of possible gopher tortoise habitat.
What do we know about gopher tortoise? • They prefer areas of deep sandy soils for burrowing. • They forage primarily on prairie grasses with wiregrass being a preferred food source. • They require open canopy for food and basking. • Landcover, soil and topography are key variables in defining gopher tortoise habitat. Can we collect and integrate these data in order to generally model possible gopher tortoise habitat?
Study Area Pearl River Stone Pearl River Stone Jackson Harrison Jackson Harrison Hancock Hancock
Model Inputs: Soils USDA SSURGO Finite soils series maps provide information on numerous soil properties. We know that gopher tortoise prefer non-flooded, sandy soils that support longleaf pine and prairie grasses such as wiregrass.
Model limits Model Inputs: Satellite Imagery 10 meter SPOT imagery gives a useful overview of landcover. Values in the image allow discrimination between forested and cleared areas. A review of the data shows that values below 12 counts indicate bottomland hardwood or dense mixed canopy. Values above 197 indicate disturbed/cutover/developed areas. We believe areas valued between 12 and 197 are candidates for inclusion in gopher tortoise habitat model.
Model Range Model Inputs: Aspect Aspect supplies the “sun face” of the landscape. We think that gopher tortoises prefer S, SW, W facing slopes for their burrows.
Model Range Model Inputs: Slope Slope is a derivative of elevation. Local slope is given in degrees. We believe that gopher tortoise prefers areas with slopes that are above .2 degrees and below 6 degrees- Not flat and not too extreme.
GT Habitat Model Logic: • If the Soil Class is “Escambia”, “Eustis”, “Lakeland”,”Latonia”,”McLaurin”, “Poarch”, • “Ruston”, “Saucier”, “Smithdale” or “Susquehanna”, there is habitat value because the soil • meets gopher tortoise preferences for non-hydric, sandy soil that supports pine and prairie grasses. • If Satellite Imagery values are between 12 and 197, the indication is that landcover is neither • dense bottomland hardwood or disturbed/cutover/developed land. • If topographic slope is between .2 degrees and 6 degrees (less than 10% slope), the • assumption is that the ‘micro-terrain’ will offer good burrow sites and access to forage sites. • 4. If topographic aspect is between 135 and 315 degrees, the “sun face” is opposite • the NW/NE quadrants. Burrow porches will provide better opportunities for sunning. • Every location in the study area will either conform to the model criteria or not. The modeling • method looks at every location and determines a degree of conformity with the criteria.
Here is an example of what the model instructions look like: if(( Layer( SSURGO, compname:c ) == "POARCH" || Layer( SSURGO, compname:c ) == "SAUCIER" || Layer( SSURGO, compname:c ) == "BENNDALE" || Layer( SSURGO, compname:c ) == "NUGENT" || Layer( SSURGO, compname:c ) == "SUSQUEHANNA" || Layer( SSURGO, compname:c ) == "MCLAURIN" ) && ( Layer( Satellite Imagery ) > 12 && Layer( Satellite Imagery ) <= 197 && Layer( Satellite Imagery ) != NO_DATA ) && ( Layer( Aspect ) > 135 && Layer( Aspect ) <= 315 && Layer( Aspect ) != NO_DATA ) && ( Layer( Slope ) > .2 && Layer( Slope ) <= 6 && Layer( Slope ) != NO_DATA )){ OD = 100.000000; A location meeting all criteria will have an output value of “100”. This indicates a good possibility of gopher tortoise habitat.
Model Output This is the result of the model run. It shows all areas in the study region that represent possible gopher tortoise habitat classified as either “prime” or “marginal”. When corridors are planned, there will be a “map” to guide transportation planners in avoidance or impact minimization. Map can be used to quantify potential impacts within selected corridor alternatives. Map can be used to plan verification field work. Map can be loaded on handheld, GPS field systems like Pocket Dlog for navigation and ground truth activities.
Prime GT Habitat Marginal GT Habitat Roads Streams USFS Field observation Of GT burrows There is observable correlation (spatially) between model output and empirical data on GT communities.
Model Statistics: Stone ~42,000 acres of prime possibility and ~94,000 acres of marginal possibility. Pearl River ~10,000 acres of prime possibility and ~21,000 acres of marginal possibility. Hancock ~27,000 acres of prime possibility and ~64,000 acres of marginal possibility. Harrison ~63,000 acres of prime possibility and ~94,000 acres of marginal possibility. Jackson ~28,000 acres of prime possibility and ~49,000 acres of marginal possibility.
Hypothetical Example of Corridor Analysis for Gopher Tortoise Habitat. Planned corridor. How much habitat is within corridor? There are ~13,000 acres of prime possibility and ~19,000 acres of marginal possibility in a total corridor area of ~79,000 acres.
Conclusion: • The method is based on a knowledge of species natural history and field observations. • The method is generally repeatable across regions given the same sets of geo-spatial data. • The method is extensible. It can be applied to habitat delineation for other terrestrial plant and animal communities. We observe that humans and trains have habitats too. • The method can be improved. Higher resolution topography (Lidar, OTF RTK) and MSS imagery can yield better spatial definition. More information on species natural history and wider field studies can contribute to model refinement.