Download
1 / 17
170 likes | 290 Views
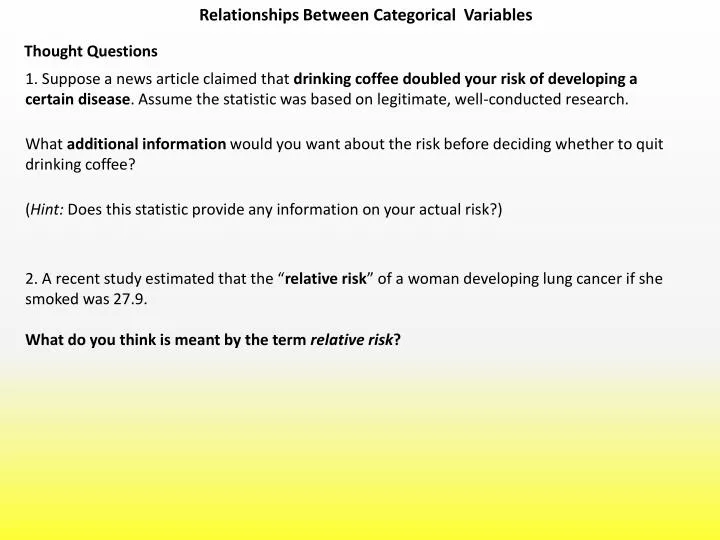
Relationships Between Categorical Variables. Thought Questions. 1. Suppose a news article claimed that drinking coffee doubled your risk of developing a certain disease . Assume the statistic was based on legitimate, well-conducted research.

E N D
Relationships Between Categorical Variables Thought Questions 1. Suppose a news article claimed that drinking coffee doubled your risk of developing a certain disease. Assume the statistic was based on legitimate, well-conducted research. What additional information would you want about the risk before deciding whether to quit drinking coffee? (Hint: Does this statistic provide any information on your actual risk?) 2. A recent study estimated that the “relative risk” of a woman developing lung cancer if she smoked was 27.9. What do you think is meant by the term relative risk?
Relationships Between Categorical Variables Thought Questions 3. A study classified pregnant women according to whether they smoked and whether they were able to get pregnant during the first cycle in which they tried to do so. What do you think is the question of interest? Attempt to answer it. Here are the results:
Relationships Between Categorical Variables Displaying Relationships Between Categorical Variables: Contingency Tables • Count the number of individuals who fall into each combination of categories. • Present counts in table = contingency table. • Each row and column combination = cell. • Row = explanatory variable. Column = response variable. Example 1: Aspirin and Heart Attacks Variable A = explanatory variable = aspirin or placebo Variable B = response variable = heart attack or no heart attack Contingency Table with explanatory as row variable, response as column variable, four cells.
Relationships Between Categorical Variables Conditional Percentages and Rates Example: Find the Conditional (Row) Percentages Aspirin Group: Percentage who had heart attacks = 104/11,037 = 0.0094 or 0.94% Placebo Group: Percentage who had heart attacks = 189/11,034 = 0.0171 or 1.71% Rate: the number of individuals per 1000 or per 10,000 or per 100,000. Percentage: rate per 100 Example : Percentage and Rate Added
Relationships Between Categorical Variables Example: Ease of Pregnancy for Smokers and Nonsmokers- Retrospective Observational Study Variable A = explanatory variable = smoker or nonsmoker Variable B = response variable = pregnant in first cycle or not Time to Pregnancy for Smokers and Nonsmokers Much higher percentage of nonsmokers than smokers were able to get pregnant during first cycle, but we cannot conclude that smoking caused a delay in getting pregnant.
Relationships Between Categorical Variables Risk, Probability, and Odds Percentage with trait = (number with trait/total)×100% Proportion with trait = number with trait/total Probability of having trait = number with trait/total Risk of having trait = number with trait/total Odds of having trait = (number with trait/number without trait) to 1 Relative Risk, Increased Risk, and Odds A population contains 1000 individuals, of which 400 carry the gene for a disease. Equivalent ways to express this proportion: • Forty percent(40%) of all individuals carry the gene. • The proportionwho carry the gene is 0.40. • The probabilitythat someone carries the gene is .40. • The riskof carrying the gene is 0.40. • The oddsof carrying the gene are 4 to 6 (or 2 to 3, or 2/3 to 1).
Relationships Between Categorical Variables Baseline Risk and Relative Risk Baseline Risk: risk without treatment or behavior • Can be difficult to find. Example: Risk of getting lung cancer if you don’t smoke. • If placebo included, baseline risk = risk for placebo group. Relative Risk: of outcome for two categories of explanatory variable is ratio of risks for each category. • Relative risk of 3: risk of developing disease for one group is 3 times what it is for another group. • Relative risk of 1: risk is same for both categories of the explanatory variable (or both groups).
Relationships Between Categorical Variables Swedish Study: Effectiveness of Population-Based Service Screening With Mammography for Women Ages 40 to 49 Years RESULTS: During the study period, there were 803 breast cancer deaths in the study group (7.3 million person-years) and 1238 breast cancer deaths in the control group(8.8 million person-years). The estimated RR (crude) for women aged 40-49 was 0.79 (95% CI, 0.72-0.86) Study Group: 803/ 7,261,415 = 0.00011 Control Group: 1238/8,843,852 = 0.00014 Relative Risk = 0.00011/0.00014 = 0.79 Relative Risk = 0.00014/0.00011 = 1.27 Breast Cancer Death Rates : Study Group vs Control Group 11 per 100,000 person-years versus 14 per 100,000 person-years Person-Years Definition: The product of the number of years times the number of members of a population who have been affected by a certain condition (years of treatment with a given drug).
Relationships Between Categorical Variables Example : Relative Risk of Developing Breast Cancer • Risk of breast cancer for women having first child at 25 or older = 31/1628 = 0.0190 • Risk of breast cancer for women having first child before 25 = 65/4540 = 0.0143 • Relative risk = 0.0190/0.0143 = 1.33 What doe this RR mean? • Increased Risk = (change in risk/baseline risk)×100% • Baseline risk for those who had child before age 25 = 0.0143 • Risk for women having first child at 25 or older = 0.0190 • Change in risk = (0.0190 – 0.0143) = 0.0047 • Increased risk = (0.0047/0.0143) = 0.329 or 32.9% What doe this increased risk mean?
Relationships Between Categorical Variables Odds Ratio Odds Ratio: ratio of the odds of getting the disease to the odds of not getting the disease. If the risk is small, about the same as the Relative Risk. Example: Odds Ratio for Breast Cancer • Odds for women having first child at age 25 or older = with breast cancer/without breast cancer = 31/1597 = 0.0194 • Odds for women having first child before age 25 = 65/4475 = 0.0145 • Odds ratio = 0.0194/0.0145 = 1.34
Relationships Between Categorical Variables STUDY: ASSOCIATION BETWEEN CELLULAR-TELEPHONE CALLS AND MOTOR VEHICLE COLLISIONS • Background • Because of a belief that the use of cellular telephones while driving may cause collisions, several countries have restricted their use in motor vehicles, and others are considering such regulations. • Methods • The study was conducted in Toronto, an urban region with no regulations against using a cellular telephone while driving. • Persons who came to the North York Collision Reporting Centre between July 1, 1994, and August 31, 1995, during peak hours (10 a.m. to 6 p.m.) on Monday through Friday were included in the study if they had been in a collision with substantial property damage (as judged by the police). • We studied 699 drivers who had cellular telephones and who were involved in motor vehicle • collisions resulting in substantial property damage but no personal injury. • Each person’s cellular-telephone calls on the day of the collision and during the previous week were analyzed through the use of detailed billing records.
Relationships Between Categorical Variables STUDY: ASSOCIATION BETWEEN CELLULAR-TELEPHONE CALLS AND MOTOR VEHICLE COLLISIONS • Time of the Motor Vehicle Collision • The time of each collision was estimated from the subject’s statement, police records, and telephone listings of calls to emergency services. • Analytic Method • We used case–crossover analysis, a technique for assessing the brief change in risk associated with a transient exposure. • According to this method, each person serves as his or her own control; confounding due to age, sex, visual acuity, training, personality, driving record, and other fixed characteristics is thereby eliminated. • We used the pair-matched analytic approach to contrast a time period on the day of the collision with a comparable period on a day preceding the collision. • In this instance, case–crossover analysis would identify an increase in risk if there were more telephone calls immediately before the collision than would be expected solely as a result of chance.
Relationships Between Categorical Variables STUDY: ASSOCIATION BETWEEN CELLULAR-TELEPHONE CALLS AND MOTOR VEHICLE COLLISIONS • Results • A total of 26,798 cellular-telephone calls were made during the 14-month study period. • The risk of a collision when using a cellular telephone was four times higher than the risk when a cellular telephone was not being used (relative risk, 4.3; 95 percent confidence interval, 3.0 to 6.5). • The relative risk was similar for drivers who differed in personal characteristics such as age and driving experience; • calls close to the time of the collision were particularly hazardous (relative risk, 4.8 for calls placed within 5 minutes of the collision, as compared with 1.3 for calls placed more than 15 minutes before the collision; P = 0.001); • Units that allowed the hands to be free (relative risk, 5.9) offered no safety advantage over hand-held units (relative risk, 3.9).
Relationships Between Categorical Variables STUDY: ASSOCIATION BETWEEN CELLULAR-TELEPHONE CALLS AND MOTOR VEHICLE COLLISIONS Weaknesses of the Study • studied only drivers who consented to participate. • people vary in their driving behavior from day to day — a fact that makes the selection of a control period problematic. • case–crossover analysis does not eliminate all forms of confounding. Imbalances • in some temporary conditions related to the driver, the vehicle, or the environment are possible.
Relationships Between Categorical Variables Misleading Statistics about Risk Common ways the media misrepresent statistics about risk: • The baseline risk is missing. • The time period of the risk is not identified. • The reported risk is not necessarily your risk. Missing Baseline Risk “Evidence of new cancer-beer connection” Sacramento Bee, March 8, 1984 Reported men who drank 500 ounces or more of beer a month (about 16 ounces a day) were three times more likely to develop cancer of the rectum than nondrinkers.
Relationships Between Categorical Variables Risk over What Time Period? “Italian scientists report that a diet rich in animal protein and fat—cheeseburgers, french fries, and ice cream, for example—increases a woman’s risk of breast cancer threefold,”Prevention Magazine’s Giant Book of Health Facts (1991, p. 122) If 1 in 9 women get breast cancer, does it mean if a women eats above diet, chances of breast cancer are 1 in 3? What other information do we need to know? Reported Risk versus Your Risk “Older cars stolen more often than new ones” Davis (CA) Enterprise, 15 April 1994 Reported among the 20 most popular auto models stolen [in California] last year, 17 were at least 10 years old.” What factors determine which cars are stolen?
Relationships Between Categorical Variables Simpson’s Paradox: The Missing Third Variable • Can be dangerous to summarize information over groups. Example: Simpson’s Paradox for Hospital Patients Survival Rates for Standard and New Treatments Risk Compared for Standard and New Treatments Looks like new treatment is a success at both hospitals, especially at Hospital B. • More serious cases were treated at • Hospital A (famous research hospital); • More serious cases were also more • likely to die, no matter what. • higher proportion of patients at • Hospital A received the new treatment. Estimating the Overall Reduction in Risk