Download
1 / 63
660 likes | 800 Views
Chemistry, The Central Science , Chapter 14, 10th edition Theodore L. Brown; H. Eugene LeMay, Jr.; and Bruce E. Bursten. Chemical Kinetics. John D. Bookstaver St. Charles Community College St. Peters, MO 2006, Prentice Hall, Inc . Modified by S.A. Green, 2006. Kinetics.

E N D
Chemistry, The Central Science, Chapter 14, 10th edition Theodore L. Brown; H. Eugene LeMay, Jr.; and Bruce E. Bursten Chemical Kinetics John D. Bookstaver St. Charles Community College St. Peters, MO 2006, Prentice Hall, Inc. Modified by S.A. Green, 2006
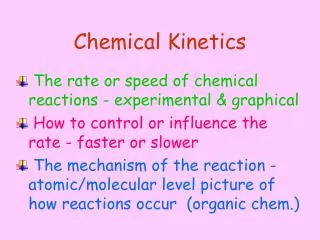
Kinetics • Studies the rate at which a chemical process occurs. • Besides information about the speed at which reactions occur, kinetics also sheds light on the reaction mechanism (exactly how the reaction occurs).
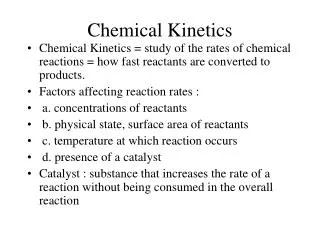
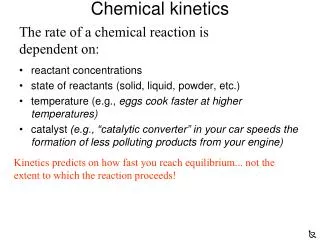
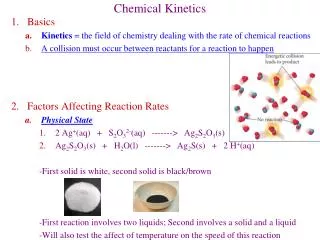
Factors That Affect Reaction Rates • Concentration of Reactants • As the concentration of reactants increases, so does the likelihood that reactant molecules will collide. • Temperature • At higher temperatures, reactant molecules have more kinetic energy, move faster, and collide more often and with greater energy. • Catalysts • Speed rxn by changing mechanism.
Reaction Rates Rxn Movie Rates of reactions can be determined by monitoring the change in concentration of either reactants or products as a function of time. [A] vs t
Reaction Rates C4H9Cl(aq) + H2O(l)C4H9OH(aq) + HCl(aq) [C4H9Cl] M In this reaction, the concentration of butyl chloride, C4H9Cl, was measured at various times, t.
Reaction Rates C4H9Cl(aq) + H2O(l) C4H9OH(aq) + HCl(aq) Average Rate, M/s The average rate of the reaction over each interval is the change in concentration divided by the change in time:
Reaction Rates C4H9Cl(aq) + H2O(l)C4H9OH(aq) + HCl(aq) • Note that the average rate decreases as the reaction proceeds. • This is because as the reaction goes forward, there are fewer collisions between reactant molecules.
Reaction Rates C4H9Cl(aq) + H2O(l)C4H9OH(aq) + HCl(aq) • A plot of concentration vs. time for this reaction yields a curve like this. • The slope of a line tangent to the curve at any point is the instantaneous rate at that time.
Reaction Rates C4H9Cl(aq) + H2O(l)C4H9OH(aq) + HCl(aq) • The reaction slows down with time because the concentration of the reactants decreases.
-[C4H9Cl] t Rate = = [C4H9OH] t Reaction Rates and Stoichiometry C4H9Cl(aq) + H2O(l)C4H9OH(aq) + HCl(aq) • In this reaction, the ratio of C4H9Cl to C4H9OH is 1:1. • Thus, the rate of disappearance of C4H9Cl is the same as the rate of appearance of C4H9OH.
Reaction Rates and Stoichiometry • What if the ratio is not 1:1? H2(g) + I2(g) 2 HI(g) • Only 1/2 HI is made for each H2 used.
aA + bB cC + dD Reaction Rates and Stoichiometry • To generalize, for the reaction Reactants (decrease) Products (increase)
Concentration and Rate Each reaction has its own equation that gives its rate as a function of reactant concentrations. this is called its Rate Law To determine the rate law we measure the rate at different starting concentrations.
Concentration and Rate Compare Experiments 1 and 2:when [NH4+] doubles, the initial rate doubles.
Concentration and Rate Likewise, compare Experiments 5 and 6: when [NO2-] doubles, the initial rate doubles.
Concentration and Rate This equation is called the rate law, and k is the rate constant.
Rate Laws • A rate law shows the relationship between the reaction rate and the concentrations of reactants. • For gas-phase reactants use PA instead of [A]. • k is a constant that has a specific value for each reaction. • The value of k is determined experimentally. “Constant” is relative here- k is unique for each rxn k changes with T (section 14.5)
Rate Laws • Exponents tell the order of the reaction with respect to each reactant. • This reaction is First-order in [NH4+] First-order in [NO2−] • The overall reaction order can be found by adding the exponents on the reactants in the rate law. • This reaction is second-order overall.
Integrated Rate Laws Consider a simple 1st order rxn: A B Differential form: How much A is left after time t? Integrate:
Integrated Rate Laws The integrated form of first order rate law: Can be rearranged to give: [A]0 is the initial concentration of A (t=0). [A]t is the concentration of A at some time, t, during the course of the reaction.
Integrated Rate Laws Manipulating this equation produces… …which is in the form y = mx + b
First-Order Processes If a reaction is first-order, a plot of ln [A]t vs. t will yield a straight line with a slope of -k. So, use graphs to determine rxn order.
CH3NC CH3CN First-Order Processes Consider the process in which methyl isonitrile is converted to acetonitrile. How do we know this is a first order rxn?
CH3NC CH3CN First-Order Processes This data was collected for this reaction at 198.9°C. Does rate=k[CH3NC] for all time intervals?
First-Order Processes • When ln P is plotted as a function of time, a straight line results. • The process is first-order. • k is the negative slope: 5.1 10-5 s-1.
Second-Order Processes Similarly, integrating the rate law for a process that is second-order in reactant A: Rearrange, integrate: y = mx + b also in the form
Second-Order Processes So if a process is second-order in A, a plot of 1/[A] vs. twill yield a straight line with a slope of k. First order: If a reaction is first-order, a plot of ln [A]t vs. t will yield a straight line with a slope of -k.
NO2(g) NO (g) + 1/2 O2(g) Determining rxn order The decomposition of NO2 at 300°C is described by the equation and yields these data:
Determining rxn order Graphing ln [NO2] vs.t yields: • The plot is not a straight line, so the process is not first-order in [A]. Does not fit:
Second-Order Processes A graph of 1/[NO2] vs. t gives this plot. • This is a straight line. Therefore, the process is second-order in [NO2].
Half-Life • Half-life is defined as the time required for one-half of a reactant to react. • Because [A] at t1/2 is one-half of the original [A], [A]t = 0.5 [A]0.
Half-Life For a first-order process, set [A]t=0.5 [A]0 in integrated rate equation: NOTE: For a first-order process, the half-life does not depend on [A]0.
Half-Life- 2nd order For a second-order process, set [A]t=0.5 [A]0 in 2nd order equation.
Temperature and Rate • Generally, as temperature increases, so does the reaction rate. • This is because k is temperature dependent.
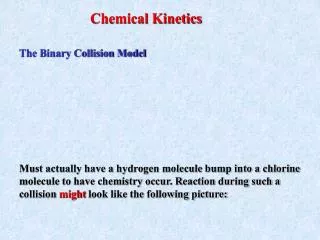
The Collision Model • In a chemical reaction, bonds are broken and new bonds are formed. • Molecules can only react if they collide with each other.
The Collision Model Furthermore, molecules must collide with the correct orientation and with enough energy to cause bond breakage and formation.
Activation Energy • In other words, there is a minimum amount of energy required for reaction: the activation energy, Ea. • Just as a ball cannot get over a hill if it does not roll up the hill with enough energy, a reaction cannot occur unless the molecules possess sufficient energy to get over the activation energy barrier.
Reaction Coordinate Diagrams It is helpful to visualize energy changes throughout a process on a reaction coordinate diagram like this one for the rearrangement of methyl isonitrile.
Reaction Coordinate Diagrams • It shows the energy of the reactants and products (and, therefore, E). • The high point on the diagram is the transition state. • The species present at the transition state is called the activated complex. • The energy gap between the reactants and the activated complex is the activation energy barrier.
Maxwell–Boltzmann Distributions • Temperature is defined as a measure of the average kinetic energy of the molecules in a sample. • At any temperature there is a wide distribution of kinetic energies.
Maxwell–Boltzmann Distributions • As the temperature increases, the curve flattens and broadens. • Thus at higher temperatures, a larger population of molecules has higher energy.
Maxwell–Boltzmann Distributions • If the dotted line represents the activation energy, as the temperature increases, so does the fraction of molecules that can overcome the activation energy barrier. • As a result, the reaction rate increases.
Maxwell–Boltzmann Distributions This fraction of molecules can be found through the expression: where R is the gas constant and T is the temperature in Kelvin .
Arrhenius Equation Svante Arrhenius developed a mathematical relationship between k and Ea: where A is the frequency factor, a number that represents the likelihood that collisions would occur with the proper orientation for reaction.
1 RT Arrhenius Equation Taking the natural logarithm of both sides, the equation becomes y = mx + b When k is determined experimentally at several temperatures,Eacan be calculated from the slope of a plot of ln k vs. 1/T.
Reaction Mechanisms The sequence of events that describes the actual process by which reactants become products is called the reaction mechanism.
Reaction Mechanisms • Reactions may occur all at once or through several discrete steps. • Each of these processes is known as an elementary reaction or elementary process.