Download
1 / 41
410 likes | 517 Views
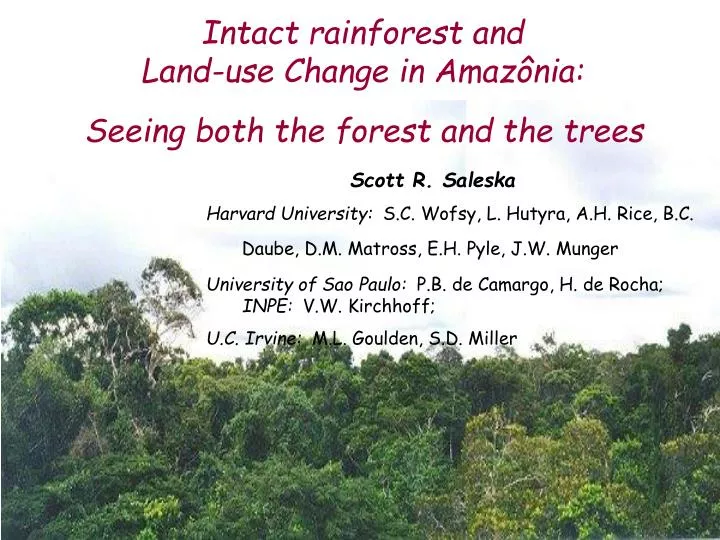
Intact rainforest and Land-use Change in Amazônia:. Seeing both the forest and the trees. Scott R. Saleska Harvard University: S.C. Wofsy, L. Hutyra, A.H. Rice, B.C. Daube, D.M. Matross, E.H. Pyle, J.W. Munger

E N D
Intact rainforest and Land-use Change in Amazônia: Seeing both the forest and the trees Scott R. Saleska Harvard University: S.C. Wofsy, L. Hutyra, A.H. Rice, B.C. Daube, D.M. Matross, E.H. Pyle, J.W. Munger University of Sao Paulo: P.B. de Camargo, H. de Rocha; INPE: V.W. Kirchhoff; U.C. Irvine: M.L. Goulden, S.D. Miller
Land-use change I (obvious):Biomass burning, conversion to agriculture
Outhouse remnants Fallen tree Land-use change II (subtle): Treefall destroys research site Outhouse
How can both kinds of changes be important? • “Changed” forest: High intensity relatively smaller area (e.g. burning, total clearing) (1.9 million ha/year in 1990s)(Source: Brazilian Space Agency, INPE) • “Intact” forest: small effect huge area (~600 million ha)
How can both kinds of changes be important? • “Changed” forest: High intensity relatively smaller area (e.g. burning, total clearing) (1.9 million ha/year in 1990s)(Source: Brazilian Space Agency, INPE) • “Intact” forest: small effect huge area (~600 million ha) ~0.3% per year change in what that intact forest is doing is comparable to all the land use change
Outhouse remnants Fallen tree Land-use change II (subtle): Treefall destroys research site Outhouse
Intact rainforest research sites in a protected reserve: the Tapajós National Forest, near Santarém, Brazil Rio Amazonas Santarém Rio Tapajós Km 67 site Km 83 site(logged Sept ’01)
58 m: Level 1 Eddy flux Profile systeminlets (8 levels) 47 m: Level 2 Eddy flux Part 1: Eddy flux (“the forest”) 64m tall tower: Tapajos forest, Km 67
2 1 - 1 0 m s -1 -2 24 22 C o 20 18 338 336 334 332 0 10 20 30 40 50 60 70 80 90 100 Eddy covariance CO2 rich Cool a) w b) T CO2 depleted Warm c) CO2 mol CO2 mol -1 Flux CO2 = w ’ CO2’ w’ = vertical wind CO2 = (CO2 + CO2’) Seconds
calm nights windy nights 10 April 12 April 14 April Date in 2001 Initial Results: Hourly time series from the Primary Forest eddy flux tower at km 67 • Eddy flux of CO2 for eddy1 (58m) and eddy2 (47m); • friction velocity (u*) (turbulence); • mean CO2 concentration 0-60m ("canopy storage"); • net ecosystem exchange (NEE = Eddy flux+ <storage change>) On windy nights (10-11 April, u*>0.2 m/s (B)) CO2 efflux (A) is strongly positive, CO2 storage (C) is low, and NEE (D) flux (A). On calm nights(12-14 April), flux (A) and u* (B) are virtually zero, and CO2 storage is high, causing NEE to be significantly higher than eddy flux.
loss to atmosphere logging at km 83 uptake 2001 2000 2001 Sum hourly fluxes to get ecosystem carbon balance over time: Summary: (1) towers agree with each other;(2) Forest ecosystem is showing net carbon loss (first in Amazonia) Cumulative Net Ecosystem Exchange (NEE) and precip Average annual C-balance over two years: Biometry start of dry season Cumulative NEE (loss to atmosphere), kg C ha-1
Some Questions • Why is the forest not in carbon balance? • How does this flux (~ 1 Mg C/ha/yr) compare to those from land-use change?
Part 2 (“the trees”): Biometric Study of Tapajós Forest, km 67 dendrometers, 1000 trees quantify woody debris, coarse fine, and litter dbh tapes, 2800 trees
4 2 0 -2 -4 -6 Carbon fluxes from live and dead biomass, 1999-2001 Recruitment, growth, mortality, and dead wood stock directly measured live wood net gain: 1.4 0.6 MgC ha-1 yr-1 net uptake| net C emission mortality growth/loss rate (Mg C ha-1 yr-1) growth recruit Live Biomass(145-160 tC/ha)
4 2 0 -2 -4 -6 Carbon fluxes from live and dead biomass, 1999-2001 Recruitment, growth, mortality, and dead wood stock directly measured Best estimate decomposition k (0.120.02 yr-1) based on field studies near Manaus (Chambers et al. 2001) live wood net gain: 1.4 0.6 MgC ha-1 yr-1 dead wood net loss: +3.3 1.1 decomp-osition net uptake| net C emission mortality growth/loss rate (Mg C ha-1 yr-1) mortality growth recruit Live Biomass(145-160 tC/ha) Dead Wood(30 – 45 tC/ha)
4 2 0 -2 -4 -6 Carbon fluxes from live and dead biomass, 1999-2001 Recruitment, growth, mortality, and dead wood stock directly measured Best estimate decomposition k (0.120.02 yr-1) based on field studies near Manaus (Chambers et al. 2001) live wood net gain: 1.4 0.6 MgC ha-1 yr-1 dead wood net loss: +3.3 1.1 whole-forestnet loss:+1.9 1.0 decomp-osition net uptake| net C emission mortality growth/loss rate (Mg C ha-1 yr-1) mortality growth recruit Live Biomass(145-160 tC/ha) Dead Wood(30 – 45 tC/ha)
4 2 0 -2 -4 -6 Carbon fluxes from live and dead biomass, 1999-2001 Net Flux is sensitive to the decomposition rate of the dead wood, k. (Note: This forest would be losing carbon even if decomposition was as low as in a temperate forest in the southern U.S.) Biometry agreeswith eddy flux Recruitment, growth, mortality, and dead wood stock directly measured Best estimate decomposition k (0.120.02 yr-1) based on field studies near Manaus (Chambers et al. 2001) live wood net gain: 1.4 0.6 MgC ha-1 yr-1 dead wood net loss: +3.3 1.1 whole-forestnet loss:+1.9 1.0 Eddy Flux+1.3 0.9 decomp-osition net uptake| net C emission mortality growth/loss rate (Mg C ha-1 yr-1) mortality growth recruit Live Biomass(145-160 tC/ha) Dead Wood(30 – 45 tC/ha)
4 2 0 -2 -4 -6 Carbon fluxes from live and dead biomass, 1999-2001 Recruitment, growth, mortality, and dead wood stock directly measured Best estimate decomposition k (0.120.02 yr-1) based on field studies near Manaus (Chambers et al. 2001) Question 1: Why is this forest not in carbon balance?Three observations to consider: (1) The balance for live wood and dead wood is in opposite directions live wood net gain: 1.4 0.6 MgC ha-1 yr-1 dead wood net loss: +3.3 1.1 whole-forestnet loss:+1.9 1.0 Eddy Flux,+1.3 0.9 decomp-osition net uptake| net C emission mortality growth/loss rate (Mg C ha-1 yr-1) mortality growth recruit Live Biomass(145-160 tC/ha) Dead Wood(30 – 45 tC/ha)
4 2 0 -2 -4 -6 Carbon fluxes from live and dead biomass, 1999-2001 Recruitment, growth, mortality, and dead wood stock directly measured Best estimate decomposition k (0.120.02 yr-1) based on field studies near Manaus (Chambers et al. 2001) • Question 1: • Why is this forest not in carbon balance?Three observations to consider: • (1) The balance for live wood and dead wood is in opposite directions • (2) Stock of above-ground dead wood is exceptionally large: • in comparison to other sites; • relative to what is needed for steady-state • ( decade of mortality inputs to accumulate the excess dead wood stock) live wood net gain: 1.4 0.6 MgC ha-1 yr-1 dead wood net loss: +3.3 1.1 whole-forestnet loss:+1.9 1.0 Eddy Flux,+1.3 0.9 decomp-osition net uptake| net C emission mortality growth/loss rate (Mg C ha-1 yr-1) mortality growth recruit Live Biomass(145-160 tC/ha) Dead Wood(30 – 45 tC/ha)
3 Mortality Outgrowth 2 1 flux, MgC ha-1yr-1 0 -1 Growth -2 Recruitment Net = 1.5 Mg C ha-1yr-1 -3 Flux from Biomass & Changes in tree number density, by size class Question 1 (cont’d): Why is this forest not in carbon balance? loss to atmosphere 95% Conf. on each bin • Observation 3: • Demographic shift: • The increase in flux to biomass isin the smaller size classes • Corresponding increase in density of tree stems in the smaller size classes uptake
3 Mortality Outgrowth 2 1 flux, MgC ha-1yr-1 0 -1 Growth -2 Recruitment Net = 1.5 Mg C ha-1yr-1 -3 40 Recruitment Net 20 density change, stems ha-1 0 Mortality Outgrowth -20 10 35 60 85 110 135 160 185 size class, cm DBH Flux from Biomass & Changes in tree number density, by size class Question 1 (cont’d): Why is this forest not in carbon balance? loss to atmosphere 95% Conf. on each bin • Observation 3: • Demographic shift: • The increase in flux to biomass isin the smaller size classes • Corresponding increase in density of tree stems in the smaller size classes uptake
Question 1: Why is this forest not in carbon balance? Hypothesis: Tapajós forest site is recovering from recent episode(s) of disturbance which: (1) Caused sharply elevated mortality preceeding onset of this study. (2) Caused a large increase in dead wood pool (to the point where losses exceed inputs) (3) Opened canopy gaps causing significant new growth and recruitment into smaller size classes of live wood (making overall growth uptake exceptionally high)
Question 1: Why is this forest not in carbon balance? Perhaps contributed to by recent El Niňo droughts? Hypothesis: Tapajós forest site is recovering from recent episode(s) of disturbance which: (1) Caused sharply elevated mortality preceeding onset of this study. (2) Caused a large increase in dead wood pool (to the point where losses exceed inputs) (3) Opened canopy gaps causing significant new growth and recruitment into smaller size classes of live wood (making overall growth uptake exceptionally high) Condit et al. (1995), Williamson et al. (2000) link El Nino to elevated tree mortality
Summary: • Net Carbon loss, because respiration losses from excess dead wood dominate gains from tree growth transient disturbance-recovery dynamic – possibly typical of old-growth forest, but not seen in eddy flux studies so far
25 20 15 10 5 0 -5 -10 -15 -20 -25 Modeled flux following disturbance in gap of a “balanced-biosphere” rainforest near Manaus npp = net primary productivity (uptake)rh = heterotrophic respiration (loss) nep = net ecosystem productivity (change in carbon balance) Mg (C) ha-1 yr-1 Tapajos Km 67 site(loss) Gap Age (time since disturbance in years) Source: Moorcroft, Hurtt & Pacala (2001)
Summary: • Net Carbon loss, because respiration losses from excess dead wood dominate gains from tree growth transient disturbance-recovery dynamic – possibly typical of old-growth forest, but not seen in eddy flux studies so far Implications for Land-use change: • Intact forest is dynamic: small changes in dynamics caused by human-induced changes in global climate can have effects comparable to more obvious land-use change:
Summary: • Net Carbon loss, because respiration losses from excess dead wood dominate gains from tree growth transient disturbance-recovery dynamic – possibly typical of old-growth forest, but not seen in eddy flux studies so far Implications for Land-use change: • Intact forest is dynamic: small changes in dynamics caused by human-induced changes in global climate can have effects comparable to more obvious land-use change: • rising CO2 could stimulate forest, causing more carbon uptake
Summary: • Net Carbon loss, because respiration losses from excess dead wood dominate gains from tree growth transient disturbance-recovery dynamic – possibly typical of old-growth forest, but not seen in eddy flux studies so far Implications for Land-use change: • Intact forest is dynamic: small changes in dynamics caused by human-induced changes in global climate can have effects comparable to more obvious land-use change: • rising CO2 could stimulate forest, causing more carbon uptake • Global warming could increase El Niño droughts, and forest disturbance, causing more carbon loss
25 20 15 10 5 0 -5 -10 -15 -20 -25 Modeled flux following disturbance in gap of a “balanced-biosphere” rainforest near Manaus npp = net primary productivity (uptake)rh = heterotrophic respiration (loss) nep = net ecosystem productivity (change in carbon balance) Mg (C) ha-1 yr-1 Tapajos Km 67 site(loss) Gap Age (time since disturbance in years) Source: Moorcroft, Hurtt & Pacala (2001)
25 20 15 10 5 0 -5 -10 -15 -20 -25 Modeled flux following disturbance in gap of a “balanced-biosphere” rainforest near Manaus npp = net primary productivity (uptake)rh = heterotrophic respiration (loss) nep = net ecosystem productivity (change in carbon balance) Amount of change in nep, that, spread across the intact Amazon, would be ~twice that from deforestation: ±1 Mg ha-1 yr-1x 600 million ha= ±0.6 Pg yr-1 ` Mg (C) ha-1 yr-1 Tapajos Km 67 site(loss) Gap Age (time since disturbance in years) Source: Moorcroft, Hurtt & Pacala (2001)
25 20 15 10 5 0 -5 -10 -15 -20 -25 Modeled flux following disturbance in gap of a “balanced-biosphere” rainforest near Manaus npp = net primary productivity (uptake)rh = heterotrophic respiration (loss) nep = net ecosystem productivity (change in carbon balance) Amount of change in nep, that, spread across the intact Amazon, would be ~twice that from deforestation: ±1 Mg ha-1 yr-1x 600 million ha= ±0.6 Pg yr-1 versus 0.3 Pg yr-1 lost from Amazonian deforestation (~1.4 Pg yr-1 global deforest.) ` Mg (C) ha-1 yr-1 Tapajos Km 67 site(loss) Gap Age (time since disturbance in years) Source: Moorcroft, Hurtt & Pacala (2001)
Summary: • Net Carbon loss, because respiration losses from excess dead wood dominate gains from tree growth transient disturbance-recovery dynamic – possibly typical of old-growth forest, but not seen in eddy flux studies so far Implications for Land-use change: • Intact forest is dynamic: small changes in dynamics caused by human-induced changes in global climate can have effects comparable to more obvious land-use change: • rising CO2 could stimulate forest, causing more carbon uptake • Global warming could increase El Niño droughts, and forest disturbance, causing more carbon loss • Integrated analysis of different kinds of change needed for full understanding of consequences of land-use change
Biometry plots upwind of flux tower, with locations & sizes of all trees >35cm, subset>10cm DBH Transects (from 35 cm DBH) (inset) Coarse Woody Debris Plots tower N Legend for CWD Plots plot size of wood area # > 30cm 1200 m2 32 10 - 30 cm 64 25 m2 (20 ha, 2800 trees, stratified) 2 - 10 cm 64 1 m2
Questions • Land-use Change: change relative to what?(i.e. what did the land do before its use was changed?) • What is “change”? • forest conversion, often by fire, to agricultural or grazing lands • Logging • Global climate change
NEE -10 0 10 20 “shut-off” of eddy transport at low turbulence… Eddy Flux -10 0 10 20 … leads to compensating build-up of CO2 in canopy Storage Flux -10 0 10 20 Idealized Relations: Q: Is there “lost flux”? We expect total nighttime NEE (which depends only on the physiology of forest respiration), to be essentially independent of atmospheric turbulence. NEE components, however, are expected to depend on turbulence, but in opposite directions. Definition: Net Ecosystem Exchange: NEE = Eddy Flux + <canopy storage> Flux out the top “Storage flux” “Turbulence” (e.g. U* = friction velocity)
Observed Relations: Q: Is there “lost flux”? We expect total nighttime NEE (which depends only on the physiology of forest respiration), to be essentially independent of atmospheric turbulence. Fall-off in NEE for U*<0.2 Answer: Yes, it looks like it. As U* 0, eddy flux decreases and storage flux increases as expected, but their sum (NEE) declines for U* < 0.2 m/sec:
Observed Relations: Q: Is there “lost flux”? We expect total nighttime NEE (which depends only on the physiology of forest respiration), to be essentially independent of atmospheric turbulence. “lost flux” Fall-off in NEE for U*<0.2 Answer: Yes, it looks like it. As U* 0, eddy flux decreases and storage flux increases as expected, but their sum (NEE) declines for U* < 0.2 m/sec: We take this as evidence of lost flux. Solution:filter out data below some U* threshold, then fill by interpolation
Summary:(1) with U* correction, towers agree with each other; logging at km 83 km67 km83 loss to atmosphere uptake (Part 1) Average annual C-balance Cumulative Net Ecosystem Exchange (NEE) and precip start of dry season uncorrectededdy flux