Interactive Visualization Services on the Grid: Enhancing Computational Applications
This document presents an overview of interactive applications on computational grids, focusing on the EU CrossGrid project. It elaborates on the role of visualization in clusters and grids, introducing the Grid Visualization Kernel (GVK) as an interface to optimize grid applications. Key elements include job submission, result analysis, and real-time interactivity in simulations, notably in biomedical and disaster response contexts. The GVK facilitates effective resource management, security measures, and enhances visualization quality, aiming to integrate user involvement seamlessly into grid computing workflows.

Interactive Visualization Services on the Grid: Enhancing Computational Applications
E N D
Presentation Transcript
Visualization Serviceson the Grid Paul Heinzlreiter, Dieter Kranzlmüller heinzlreiter|kranzlmueller@gup.jku.at GUP LinzJoh. Kepler University Linz
Contents • Motivation: interactive applications on the grid • The EU CrossGrid project • Visualization in clusters and grids • The Grid Visualization Kernel GVK • Interface to grid applications • Pipeline optimization • Conclusions CCGSC 2002
Motivation Computational grids are ... • large-scale distributed computing infrastructures, that • offer ubiquitous access to networked resources • for integrated and collaborative use by multiple organizations Most “valuable” resources: computing/storage CCGSC 2002
Grid Computing Grid middleware services (Globus, …): • Security • Communication • Fault detection • Resource and data management • … Batch processingThroughput computing CCGSC 2002
Grid Computing 3 Steps of current grid applications: • Submit job to the grid • Receive results from the grid • Analyze results Visualization CCGSC 2002
Visualization? • Interactivity is needed to control the application while it is running on the grid • At least „some“ applications benefit from interactive visualization services CCGSC 2002
EU CrossGrid Project 03/2002-02/2005 21 Partners11 Countries CCGSC 2002
The CrossGrid Project Goal: • Extensions for Interactivity on the Grid • Interactive grid applications • Biomedical simulation • Flooding crisis simulation • … • “Putting the user into the loop” CCGSC 2002
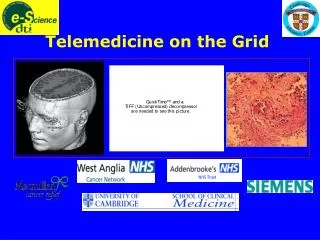
Example: Biomedical Simulation on the Grid CCGSC 2002 Figure Courtesy University Amsterdam (UvA)
Example: Biomedical Simulation on the Grid CCGSC 2002 Figure Courtesy University Amsterdam (UvA)
Influencing the Simulation Change parameters and see how they influence the results of the simulation CCGSC 2002 Figure Courtesy University Amsterdam (UvA)
“Putting the User into the Loop” CCGSC 2002
Visualization Simulation Visualization CCGSC 2002
Example: Flooding Crisis Simulation on the Grid Detect possible flooding situation through forecasting CCGSC 2002
Example: Flooding Crisis Simulation on the Grid Detect possible flooding situation through forecasting CCGSC 2002
Flood Crisis Support Simulation on the Grid: • Meteorological • Hydrological • Hydraulic Parameter studies: >1000 simulations Problem: data analysis CCGSC 2002
Nosice (Outflow point) Strečno (Inflow point) Pilot Site Catchment Area: 2500km2 Váh River Catchment Area: 19700km2, 1/3 of Slovakia Flooding Crisis Support CCGSC 2002 Figure Courtesy Slovak Academy of Sciences
CCGSC 2002 Figure Courtesy Slovak Academy of Sciences
Flooding Crisis Support CCGSC 2002
Simulation Visualization on the Grid ??? Visualization Grid CCGSC 2002
Visualization on Clusters and Grids • Chris Johnson, SCI Utah:Real Time Raytracer • Chromium Cr (Cluster Renderer):32 Compaq SP 750 + Myrinet • David O´Hallaron, CMU: Dv: remote visualization • Ed Seidel: CACTUS • SGI OpenGL Vizserver: framebuffer over network • Collaborative Environments: DIVE, AccessGrid • ... CCGSC 2002
Real Time Ray Tracer Visualization of Protein Molecules on up to512 processors Chris JohnsonSCI Utah & Klaus Schulten Theo. Biophysics Group, UIUC CCGSC 2002
Simulation Visualization Connection? GVK ??? Grid Visualization Kernel CCGSC 2002
Grid Visualization Kernel Simulation • is decoupled from the visualization (temporal/spatial) • is running „somewhere on the grid“ • is a „moving target“ in a heterogeneous environment Visualization • may be invoked anytime, anywhere, anyhow • may be invoked by multiple people (multiplexing) • should be as fast/good as possible (via any network) CCGSC 2002
Grid Visualization Kernel Goal: Visualization services for the grid GVK = „Globus™ for Visualization“ Side-effect: GVK uses the grid to obtain sufficient performance CCGSC 2002
Exploitation of the Grid • Grid delivers computational power which can be used for visualization. • Parallelization strategies for visualization algorithms • Triangle mesh partioning (Metis) • Raytracing parallelization on pixel level • Reference image rendering on different nodes • ... CCGSC 2002
GVK Structure CCGSC 2002
GVK Basic Services • Relies on Grid Services provided by Globus • Resource Discovery (MDS, GRIS) • Resource Allocation (GRAM) • Data Transmission (Globus IO, GridFTP) • Security (GSI) CCGSC 2002
Example GVK Data Flow CCGSC 2002
Visualization Request • Input for visualization planning module • Consists of: • Data source(s) • Visualization frontend(s) • Visualization mode(s) • Required visualization quality • Interaction possibilities CCGSC 2002
Example GVK Data Flow CCGSC 2002
“Immediate” Goals of GVK • Input/Output Interfaces: • Use existing technology (OpenDX, AVS, VTK, ...) • Virtual Reality Output (CAVE) • OpenGL Renderer • Efficient network connection: • Decrease communication latency • Increase system throughput CCGSC 2002
Input/Output Interfaces SimulationOpenDX VisualizationOpenDX GVK CCGSC 2002
Integration into Visualization Toolkits • GVK services are called from visualization modules • Data conversion and visualization tasks are performed transparently by GVK • Integration possibilities: • GVK as output device (remote visualization) • GVK performs main part (data input, visualization output) • Particular visualization modules are replaced by GVK functionality CCGSC 2002
GVK Integration ExampleOpenDXflow graph CCGSC 2002
GVK Integration ExampleOpenDXflow graph using GVK CCGSC 2002
“Immediate” Goals of GVK • Input/Output Interfaces: • Use existing technology (OpenDX, AVS, VTK, ...) • Virtual Reality Output (CAVE) • OpenGL Renderer • Efficient network connection: • Decrease communication latency • Increase system throughput CCGSC 2002
Optimizations: Idea Visualization Pipeline CCGSC 2002
Traditional Pipeline Configurations • Client: Filtering+Visualization+Rendering • Server: FilteringClient: Visualization+Rendering • Server: Filtering+VisualizationClient: Rendering • Server: Filtering+Visualization+Rendering CCGSC 2002
Optimizations Integration CCGSC 2002
GVK Optimizations • Most important: • Cope with limited network bandwidth • Minimize latency during interaction • Use well-known computer graphics approaches: • Occlusion Culling • Image-based Rendering • Level-of-Detail CCGSC 2002
GVK Optimizations • Level-of-detail filtering • Occlusion-culling • Reference and image-based rendering Comparison: • Computer graphics hardware: overcome bus transfer bottleneck CCGSC 2002
Level-of-Detail Filtering • Input data: multi-resolutional/hierarchical meshes(e.g. numerical simulation) • Instead of transferring the complete mesh, choose higher level mesh • While user explores the coarse-grain mesh, transfer remaining data • Enables adoption to available network bandwidth CCGSC 2002
Server: Choose coarse LOD Transfer data Choose finer LOD Transfer data Choose coarse LOD Transfer data Client: Display data Move in scene Display data Level-of-Detail CCGSC 2002
Level-of-Detail CCGSC 2002
Occlusion Culling • Reduce the number of transferred polygons • Divide polygon set into • Visible polygons • Remaining (occluded) polygons • Initially transfer only visible polygons • While user explores the scene, transfer remaining data CCGSC 2002
Occlusion-Culling CCGSC 2002
Occlusion-Culling CCGSC 2002
Reference and Image-based Rendering • Exploit the computational power of the grid for software rendering: • Rendering of reference images • Rendering of partial images • Use image blending to produce interacive real-time visualizations out of the reference images • Assemble partial images to final representation CCGSC 2002
Reference and Image-based Rendering • Server performs reference rendering • High performance is needed • Better quality can be obtained • Client receives series of reference images • Client constructs final image through image-based rendering techniques • Advantage: stereoscopic images CCGSC 2002