Download
1 / 1
10 likes | 119 Views
0. 0. 0. -1. 0. -1. 0. -1. 0. 1. 2. 0. 1. 1. 0. 1. 0. 0. 1. -1. 0. 3. 1. 1. 1. 5. 0. 1. 1. 1.0. 0.8. 0.6. 0.4. 0.2. 0.0. 1. 1. 1. -1. -1. -1. 1. 0. 1. 2.0. 1.5. 1.0.

E N D
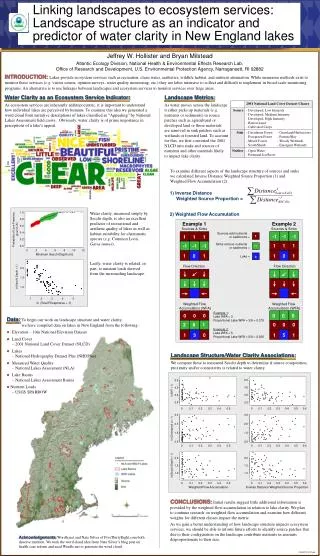
0 0 0 -1 0 -1 0 -1 0 1 2 0 1 1 0 1 0 0 1 -1 0 3 1 1 1 5 0 1 1 1.0 0.8 0.6 0.4 0.2 0.0 1 1 1 -1 -1 -1 1 0 1 2.0 1.5 1.0 Linking landscapes to ecosystem services: Landscape structure as an indicator and predictor of water clarity in New England lakes Jeffrey W. Hollister and Bryan Milstead Atlantic Ecology Division, National Health & Environmental Effects Research Lab,Office of Research and Development, U.S. Environmental Protection Agency, Narragansett, RI 02882 INTRODUCTION:Lakes provide ecosystem services such as recreation, clean water, aesthetics, wildlife habitat, and nutrient attenuation. While numerous methods exist to monitor these services (e.g. visitor counts, opinion surveys, water quality monitoring, etc.) they are labor intensive to collect and difficult to implement in broad-scale monitoring programs. An alternative is to use linkages between landscapes and ecosystem services to monitor services over large areas. Water Clarity as an Ecosystem Service Indicator:As ecosystem services are inherently anthropocentric, it is important to understand how individual lakes are perceived by humans. To examine this idea we generated a word cloud from narrative descriptions of lakes classified as “Appealing” by National Lakes Assessment field crews. Obviously, water clarity is of prime importance in perceptions of a lake’s appeal. Landscape Metrics: As water moves across the landscape it either picks up materials (e.g. nutrients or sediments) in source patches such as agricultural or developed land or those materials are removed in sink patches such as wetlands or forested land. To account for this, we first converted the 2001 NLCD into sinks and sources of nutrients and other materials likely to impact lake clarity. To examine different aspects of the landscape structure of sources and sinks we calculated Inverse Distance Weighted Source Proportion (1) and Weighted Flow Accumulation (2). 1) Inverse Distance Weighted Source Proportion = Water clarity, measured simply by Secchi depth, is also an excellent predictor of recreational and aesthetic quality of lakes as well as habitat suitability for charismatic species (e.g. Common Loon, Gavia immer). 2) Weighted Flow Accumulation Example 1 Sources & Sinks Example 2 Sources & Sinks Probability of Loon Presence, given X>Xc Sources add nutrients or sediments = Sinks remove nutrients or sediments = 0 2 4 6 8 10 12 Minimum Secchi Depth (m) Lake = 0 Lastly, water clarity is related, in part, to nutrient loads derived from the surrounding landscape. Flow Direction Flow Direction ln(Secchi Depth + 1) 1 2 3 4 5 Weighted Flow Accumulation (WFA) Weighted Flow Accumulation (WFA) ln (Total Phosphorus + 1) Example 1: Lake WFA = 3 Proportional Lake WFA = 3/8 = 0.375 • Data:To begin our work on landscape structure and water clarity, we have compiled data on lakes in New England from the following: • Elevation – 10m National Elevation Dataset • Land Cover – 2001 National Land Cover Dataset (NLCD) • Lakes – National Hydrography Dataset Plus (NHDPlus) • Measured Water Quality – National Lakes Assessment (NLA) • Lake Basins – National Lakes Assessment Basins • Nutrient Loads – USGS SPARROW Example 2: Lake WFA = 5 Proportional Lake WFA = 5/8 = 0.625 Landscape Structure/Water Clarity Associations:We compare these to measured Secchi depth to determine if source composition, proximity and/or connectivity is related to water clarity. 5.5 5.5 4.5 4.5 ln(N/P + 1) 3.5 3.5 2.5 2.5 0 0.1 0.2 0.3 0.4 0.5 0 0.1 0.2 0.3 0.4 0.5 0.6 3.5 3.5 2.5 2.5 ln(Chlorophyll a + 1) 1.5 1.5 0.5 0.5 0 0.1 0.2 0.3 0.4 0.5 0 0.1 0.2 0.3 0.4 0.5 0.6 2.0 2.0 ln(Secchi Depth + 1) 1.5 1.5 1.0 1.0 0 0.1 0.2 0.3 0.4 0.5 0 0.1 0.2 0.3 0.4 0.5 0.6 Weighted Flow Accumulation Inverse Distance Weighted Source Proportion CONCLUSIONS:Initial results suggest little additional information is provided by the weighted flow accumulation in relation to lake clarity. We plan to continue research on weighted flow accumulation and examine how different weights for different classes impact the metric. As we gain a better understanding of how landscape structure impacts ecosystem services, we should be able to inform future efforts to identify source patches that due to their configuration on the landscape contribute nutrients in amounts disproportionate to their size. Acknowledgements: Wordle.net and Nate Silver of FiveThirtyEight.com both deserve mention. We took the word cloud idea from Nate Silver’s blog post on health care reform and used Wordle.net to generate the word cloud. USial2010-3-31.ppt