### Utilizing Data for Effective Addiction Prevention: Insights from Tennessee's Advanced School on Addictions ###
430 likes | 548 Views
The Tennessee Advanced School on Addictions offers critical insights into utilizing data for effective addiction prevention strategies. This event, held on June 22-23, 2010, focused on the importance of data in identifying community needs and measuring the impact of prevention efforts. Attendees explored various data types, strategies for assessment and evaluation, and how to address gaps in current data collection. Expert Angela Goldberg directed discussions on data's role in understanding alcohol and other drug (AOD) issues, framing actionable prevention planning within the Strategic Prevention Framework (SPF). ###

### Utilizing Data for Effective Addiction Prevention: Insights from Tennessee's Advanced School on Addictions ###
E N D
Presentation Transcript
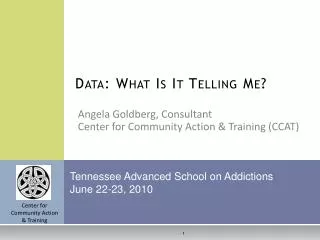
Data: What Is It Telling Me? Tennessee Advanced School on Addictions June 22-23, 2010 Center for Community Action & Training Angela Goldberg, Consultant Center for Community Action & Training (CCAT)
Agenda3 whos + whys+ 4 What's=Success • Three Who’s to Consider • How to Use Data in Beginning , Middle and End • Four Types Of Data To Use In Prevention Planning and Evaluation • Data Strategies To Fill Gaps
Thinking about the Who • Universal • Broad; e.g. all students at the school • Selective • Risk by virtue of membership in a subgroup; e.g. children of substance using parents • Indicated • Individuals who exhibit early signs or consequences of AOD use IOM
The WHO • Data Is Different • Data Informs Choice of Different Strategies
Three Stages of Using DataGetting the Problem into Focus Assessment • Nature of the Problem • Needs and Resources • Begin with the End in Mind
Other Data in Planning • Assess Community Readiness • Power Analysis – Who Can Make The Change • What’s The Community’s History Of Problem Solving? • Getting Beyond Archival (Student Surveys, Crime Data…) • Quantitative & Qualitative
What Are You Looking For? • Measuring individual behavior leads to efforts to change those individuals • Measuring environments leads to efforts to change environments • Not only ‘Who’ and ‘What’ but also ‘When’ ‘Where’ and ‘How’
Sensitive Assessment Environmental • Outlet Density • Rates Of Sales To Minors • Aggregate Law Enforcement Data • Community Indicators Such As DUI Rates • Belief/Attitudes Towards Policy Issues Individual • Individual Drinking Rates • Beliefs • Attitudes • Family History • Individual Problem Use Rates (CHKS) • Changes in Knowledge
Interpreting Data • No Single Indicator Tells The Story • Need to triage with multiple sets • Understand The Data Limitations • Trends = Seven Points In One Direction • Who Examines? Bias, Skills & Values All Have A Role
Good Measures • The “SPF” of Data: • S • P • F
Table Sharing on data Use 3-5 minutes to consider your capacity in: • Quantitative data collection • Qualitative data collection Use the remaining time to answer: • What data sources do you currently use to know about AOD problems? • What data do you wish you had? 10 Minutes Total: Select a Recorder, Reporter, Timekeeper
Data in Assessment • Four kinds of data collected will define the problems to address. • Both qualitative and quantitative data are essential. • Assessment should result in clear problem statements and priorities to address. • The assessment clearly sets the stage for evaluation.
How Much of What? • The key is not simply to collect boxes and boxes of data, but rather to focus on the kinds of data that will help you understand the link between alcohol and other drugs and the problems.
Use data • What Specific Indicator About Use? • 30 day? Lifetime? • What Period Of Time? • Calendar? School Year? How Many Years? • Unit of Analysis • School, District, County, State, National
Data MiningBreaking it down to find meaning Example Looking at Manner of Death by Age Reveals Patterns
Use Data Archival Sources • Youth Use • YRBS: www.cdc.gov/HealthyYouth/yrbs.htm • SAMSHA’s Office of Applied Statistics: • http://www.oas.samhsa.gov/alcohol.cfm • Adult Use • www.oas.samhsa.gov/nhsda.htm • www.monitoringthefuture.org
Consequences Data • Health • School / Work / Family • Traffic Collision & Injury • Arrest & Criminal Justice Involvement
Consequences Data Sources • Hospital, Medical Examiner, Treatment System • District Suspensions • Fatality Analysis Reporting System for NHTSA • www-fars.nhtsa.dot.gov/States/StatesAlcohol.aspx • Arrests, Probation
Contributing Factors May Include: • Availability • Youth Access • Community Norms • Perception of Harm
Data on Contributing Factors WHY? • Less Likely To Be Archival • Data Hunt • Look and Listen
Local Conditions Such As: • Local Retail Environments • Patterns of Social Access • Near Peer, Parents, Parties • Alcohol Presence in Community Events • Local Economies Built around AOD
Data Exercise • At your tables, pick one problem together, and one place or population. Identify data sources for the problem, contributing factors and local conditions. • Identify any data gaps you want to fill. 15 Minutes Total: Select a Recorder, Reporter, Timekeeper
Using Your Data • What are the key assessment findings? • Based on the key data findings, what prevention priorities have been identified? • How do these priority areas translate into specific problem statements? • Which key findings be used to help determine outcome measurement indicators for evaluation?
Data Drives Planning Local Conditions / Contributing Factors/ (Generic) Problem The CADCA Problem Analysis Process
Data-Based or No Go Identify at least two sources of data for every point Local Conditions / Short Term Objectives Contributing Factors/ Objectives (Generic) Problem /Goal The CADCA Problem Analysis Process
Making the Right Match The Essential Questions: • Does your strategy address the contributing factors? • Does your strategy fit the population or setting?
Data Helps You Make Your Case • What Is Happening? • How Will Your Strategy Produce The Desired Change? • How Can You Show The Difference?
Logic Model: Guide • Does it add up? • Informs you about what data you need to look at change at short term, intermediate and long term levels
Pulling it all together • No Single Bullet • Coalitions and Agencies Make Great Partners • Data Help • Linkages re Services • Comprehensive
Finding Meaning over Time • Track Data at short, intermediate and long range periods, per logic model • Look for Change • Is today different than at baseline? • What Happened (Process), and What Difference (Impact) Occurred?
Experimental Design? • Re-think Your Expectation • Consider “Contributes to rather than Attribution”
Intermediate • Did One Thing Lead To The Other? • How Do You Know? • Follow Your Logic Model to the Right Indicators
Evaluation • Did Change Happen? • Your Original Data Can Be Revisited • Long Term Change Most Likely Archival
Data Strategies • GIS • Surveys • Observations • Interviews • Focus Groups • Neighborhood Talks • Town Halls
GIS Mapping GIS Maps Paint The Picture
Neighborhood Talks Two-Thirds Of Respondents SaidThat Alcohol Problems Keep Families Away From The Park. Who Did We Talk With? • 35 households on Meadow, Milo and Cotton Streets. • 59% Female; 41% male • 54% Latino; 23% Caucasian; 14% African American • 60% either had raised or were raising teenagers Two-thirds of Neighbors Have Concerns about Drinking at the Park • When asked about specific concerns, those who responded shared concerns such as violence and rowdiness, underage drinking, trash, and impact on young children. The biggest specific concern mentioned was violence and rowdiness at 27%.
Focus Groups • Youth In Programs Are Experts • Think Through Your Protocol • Compose Groups • Facilitate, Record
Place of Last Drink Survey ResultsOceanside, CA • Total in the last year = 233 (Carlsbad=105, Oceanside=85, and Vista=43) • One primary cluster of problem outlets in Carlsbad; two secondary clusters in Oceanside
Surveys 1 in 4 adult community survey respondents felt it was “somewhat” or “very” acceptable to allow youth to drink alcohol in their home % Youth Survey Respondents Who Reported Drinking in Their Homes
Data is Your Friend • Use Facts, Not Opinion • Find Your Gaps And Fill Them • Use Your Findings To Strengthen And Succeed
Contacts • Center for Community Action & Training www.ccat-ca.org • Angela Goldberg • 760-749-8792 • angelagoldberg@sbcglobal.net