Download
1 / 16
160 likes | 191 Views
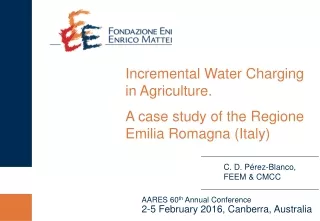
This research delves into managing water scarcity in Emilia-Romagna through revealed preferences, simulating incremental water charges and assessing economic impacts. Coupling micro and macro levels, the study investigates economic trade-offs and efficiency in water conservation measures.

E N D
The context: droughts in the Regione Emilia Romagna (Italy) > 4.5 M inhabitants > 22 547 km2 > 11.3% Italy’sagricultural GVA > 7.5% Italy’sagriculturalemployment > Wheat (38.1%), corn (25.1%), other cereals (18%), fruit trees and vineyards (10.2%) • > Water use in the RER has increased over the last decades • > Drought spells are increasingly frequent • > State of Emergency declared three times (2003, 2006, 2007) for a total of 21 months 1
A highly engineered river – for millennia • > Water is abundant in normal years • > (often too much!) • > WFD: guarantee the good ecological status & cost recovery • > Po RBD: voluntary agreements (effective? Costly?) • > WFD: pricing -> but often costs of withdrawals ≈ 0! 2
Incremental water charging • > Charges short run marginal cost > on top of the long run marginal cost (partially) addressed by conventional charging arrangements • > Goal: recover the costs that arise during drought events, including: • > Environmental costs • > Resource costs • > Simulations are run using a Revealed Preference Model (Pérez-Blanco et al., 2015) 3
The model > Preferences are revealed in two stages (AgriDist level): > First, relevant attributes are obtained > Second, the utility function is calibrated 4
The model (II) – Revealing the attributes Expected Profit Five (m=5) attributes explored: > Expected gross variable margin (z1) > risk avoidance (z2) > Total labor avoidance (z3) > hired labor avoidance (z4) > Variable costs avoidance (z5) pO Avoided risk Management complexity 5 5
The model (III) – Calibrating the Utility function > In equilibrium the MTR equals the MSR > Efficiency frontier is known -enough to integrate a utility function (observed decision = optimal decision) > Taking a CRE Utility Function (Cobb-Douglas) 6
Simulation results > Incremental charges from 0 to 100 Eurocents/m3 are tested > Water use, gross variable margin, employment generation and gross value added are assessed 8
Coupled micro-macro level > What happens economy-wide? > Macroeconomic models (CGE, IO) > (Most) macro models do not explicitly include water as a factor of production. More importantly, in the EU: > water rights are allocated following criteria other than efficiency (e.g. historical rights, queuing), > charges are determined by the administration (typically based on the capital investments needed to convey water to farmers) > The regional detail of the CGE model makes possible utilizing the microeconomic outputs of the RPM as inputs in the CGE model • > Coupled micro-macro model (RPM-regionally calibrated CGE) • > We introduce a (negative) homogeneous, productivity shock on labor, capital and land in the representative agricultural firm • > The shock reproduces estimated losses in the micro model –only this time in a macro context 10
Conclusions > Water use elastic in the range 0-54 Eurocents/m3 > Macroeconomic impacts increase with charges > Goal of ↓ 25 Mm3 > 14.4 M€ (.58 €/m3) - Micro > 15.9 M€ (.63 €/m3) - Macro > Goal of ↓ 100 Mm3 > 198.7 M€ (.96 €/m3) - Micro > 223.3 M€ (1.09 €/m3) - Macro > Significant economic impacts > Effective? Compare against alternative instruments (regulation, insurance + reg) > Efficient? 11
Thanks for your attention This research is part of a project that has received funding from the European Union’s Horizon 2020 research and innovation programme under the Marie Skłodowska-Curie grant agreement No 660608. http://wateragora.eu/ 12
Annex 13
Expected Profit Farmer’s Indifference curve pO Avoided risk bp,s Managementcomplexity Through his decision, the farmer reveals his Marginal Willingness to Pay to avoid a certain risk, the tangent of the angle β1, which is the same as the Marginal Relation of Transformation between net margin and risk (according to the choice possibilities frontier) and the Marginal Relation of Substitution between these two attributes (according to farmer’s implicit preferences) 14
Error terms 15