Download
1 / 18
180 likes | 370 Views
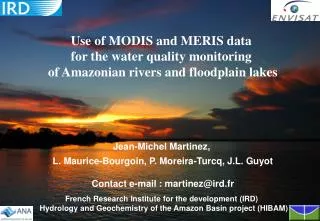
Use of MODIS and MERIS data for the water quality monitoring of Amazonian rivers and floodplain lakes Jean-Michel Martinez, L. Maurice-Bourgoin, P. Moreira-Turcq, J.L. Guyot Contact e-mail : martinez@ird.fr French Research Institute for the development (IRD)

E N D
Use of MODIS and MERIS data for the water quality monitoring of Amazonian rivers and floodplain lakes Jean-Michel Martinez, L. Maurice-Bourgoin, P. Moreira-Turcq, J.L. Guyot Contact e-mail : martinez@ird.fr French Research Institute for the development (IRD) Hydrology and Geochemistry of the Amazon Basin project (HIBAM)
Context • Satellite data are routinely used for monitoring of ocean waters (primary production) • Low resolution sensor specialized such as Sea-Wifs • Complex models developed for inversion (radiative transfer, NN) • Few works on inland waters by satellite, problems are : • Fast changing and complex water quality (Sediment, chlorophyll, organic matter) • Spatial resolution • Radiometric resolution • Time resolution New sensors such as MODIS (launched in 2000) & MERIS (launched in 2002) offer the trade off between space/radiometric/time resolutions
Objective • To quantify how medium resolution sensors allow to monitor water quality in Amazonian rivers and floodplain lakes • Analysis of MODIS & MERIS images in conjunction with HIBAM field campaign and network station database giving main water quality parameters Methodology
Remote sensing data • MODIS (Terra) MOD09_L2G products calibrated and atmospherically corrected • 250 & 500-meter resolution, 1 image / day, 2 & 5 bands • MERIS (ENVISAT) Full resolution mode (acquired trough an ESA Category-1 user project) • 300-meter resolution, 1 image / 3 days, 15 bands ETM + MODIS MERIS Spectral resolution : 400 500 600 700 800 900 l (nm)
Amazonian waters • 3 kinds of waters : • White water rich in suspended sediments (SS) and major elements • Black water rich in DOC/POC and poor in suspended sediments • Clear waters moderately enriched in nutrients and poor in SS
The 4 seasons of the floodplain lakes • Rising stage : River water entering (moderate to high TSS* : 50 to 150 mg/l) - Low biological activity • High waters: Deposition (low TSS < 30 mg/l) and increasingprimary production (phytoplanctonic blooms) • Decreasing stage : Deposition (low TSS 30 mg/l) and maximum biological activity • Low water stage : shallow depth & re-suspension process under wind effect (very high TSS : 100 - 1000 mg/l) - Low biological activity *TSS : Total Suspended Sediment (in mg/l)
Sub-Catchment of 3500 km² Test site : the Várzea of Curuaí Óbidos Amazon river Santarém Tapajós river 0 100 km
Pure Water Increasing TSS Spectral profile using MERIS of the floodplain water : rising stage TSS data from the HYBAM project database
Increasing TSS Spectral profile using MERIS of the floodplain water : high waters
Spectral profile using MERIS of the floodplain water : high waters
Increasing TSS Spectral profile using MERIS of the floodplain water : low water stage
Implications for water quality monitoring • Analysis • PCA shows that the reflectance is firstly affected by the TSS concentration • TSS & Chlorophyll both affect Green and Red bands for low TSS values • Black waters : the organic matter absorption predominates • TSS monitoring • Retrieving model : linear model fitted by least square method using the 705 nm band for low TSS and the 775 nm band for high TSS • Accuracy assessment (Parametric Bootstrap) : Season Bands used Unbiased Residual STD Relative error (/) (mg/l) (%) Rising water 2003 705 & 775 22 34 Rising water 2004 705 & 775 18 23 High water 681 & 775 5.5 32 Low water 705 & 775 53 21
MODIS bands A glance of MODIS using MERIS
MODIS view of the Amazon river Amazon river Tapajós river Madeira river 300 km
Amazon Solimões Lower Madeira Upper Madeira Amazonian rivers : MODIS vs TSS TSS data from the ORE HYBAM-IRD measurement network
Potential of MODIS images • MODIS spatial resolution (250 & 500-meter modes) is efficient for monitoring of suspended sediment fluxes in the rivers • Low sensitivity of the reflectance to the viewing geometry • MODIS temporal resolution is idealforthisclouded region • Poor spectral resolution is a drawback in productive waters • No saturation of the signal up to 1600 mg/l • Signal is moderatly dependent on the river and on time • Like MERIS, retrieval model using MODIS Red band for low TSS values & the NIR band for the high TSS
Amazon Solimões Lower Madeira MODIS predicted TSS vs measured TSS data from the ORE HYBAM-IRD measurement network
Conclusions/Perspectives • This study proves that MERIS & MODIS data are well adapted for river water quality monitoring • MERIS spectral resolution allows to monitor both TSS and primary production in the floodplain lakes • Accuracy and availability (low cost & temporal resolution) of MODIS data make them an operational tool for TSS retrieval • Insertion in existing monitoring network • Future works : • Refined assessment of the impact of water and sediment properties on the reflectance • Extension of field data to 2003 & 2004