Download
1 / 61
610 likes | 686 Views
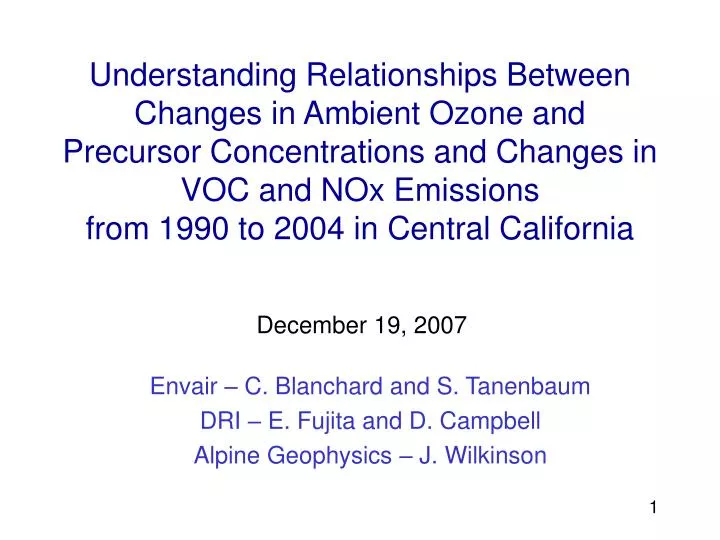
Understanding Relationships Between Changes in Ambient Ozone and Precursor Concentrations and Changes in VOC and NOx Emissions from 1990 to 2004 in Central California. December 19, 2007. Envair – C. Blanchard and S. Tanenbaum DRI – E. Fujita and D. Campbell Alpine Geophysics – J. Wilkinson.

E N D
Understanding Relationships Between Changes in Ambient Ozone and Precursor Concentrations and Changes in VOC and NOx Emissions from 1990 to 2004 in Central California December 19, 2007 Envair – C. Blanchard and S. Tanenbaum DRI – E. Fujita and D. Campbell Alpine Geophysics – J. Wilkinson
Today’s Topics • Project overview • Phase I: summary of results • Phase II: objectives and schedule • Phase II: summary of results
I. Project Overview • Phase I (completed) • Databases and methods • Ozone and precursor trends by site and by subregion • Precursor trends compared to county-level emission trends • Meteorological classifications • Ozone trends for all high-ozone days and by meteorological class
I. Project Overview (continued) • Phase II (in progress) • Grid emission inventories, 1990-2004 • Relate ambient primary-pollutant trends to zone-of-influence emission trends • Relate ozone trends to ambient and emission trends of precursors, and to meteorological conditions • Submit final report
1990 – 2004 AQ Trends Summary • No trends significantly upward* • NOx sig* down at 22 of 28 sites** • CO sig* down at 21 of 25 sites** • NMOC sig* down at 5 of 7 sites*** • Ozone sig* down at 7 of 42 sites** • Annual mean top-60 ozone trends similar to trends in annual 4th-highest 8-hour max *p < 0.05 ** At least 10 years data. One or both metrics. *** 7 - 10 years data
Phase I Findings: Precursor Trends • On average, ambient precursor decreases are comparable to county-level emissions decreases • There is a possibility that emission decreases are overestimated or underestimated for some counties • Confirmation requires comparison of site trends to spatially-resolved emission trends (Phase II)
X (Artifact due to site relocation)
Phase I Findings: Ozone Trends • Phase I analyses demonstrate spatial variations of ozone concentrations and trends but do not explain them • Site-to-site variations and directional variations of mean concentrations suggest importance of local ozone formation • More detailed analyses in Phase II • Potential limitation is signal-to-noise
Meteorological Classification • Principal component analysis (PCA) of regional-scale met variables • K-means clustering of PCs PCA applied to all days of all years from 1990 to 2004 (n = 5480** days) Clustering applied to all ozone-season days (n = 2790 days) ** 5441 with pressure gradient data; 4202 with 850 mb data
Clusters separate days into groups with different 850 mb wind directions
Characteristics of Met Clusters • Cluster 1: N and E 850 mb winds, lower surface pressure at San Francisco than elsewhere, and low surface wind speeds. Mean ozone and precursor concentrations are high due to generally poor ventilation. • Cluster 2: SW 850 mb winds and higher surface wind speeds than in cluster 1. • Cluster 3: more W 850 mb winds and higher surface wind speeds. Mean ozone ~ 5 to 15 ppbv lower than in cluster 1. • Cluster 4: similar to cluster 1, but with better ventilation and 850 mb winds that are on average more N than for days in cluster 1.
Mean peak 8-hour ozone concentrations varied among sites, subregions, and met types – these days are all top-60 peak 8-hour days
III. Phase II: Objectives and Schedule • Objectives • More accurate comparison of sites’ AQ trends with “zone-of-influence” emission trends • Better understanding of ozone trends at sites within each subregion and the relation of ozone to precursor trends and meteorological variation • Schedule – Complete by end of December
Phase II Tasks • Task 5: Prepare gridded emission inventories, 1990 – 2004 • Task 6: • (a) Compare “zone-of-influence” emission trends to ambient primary-pollutant trends. • (b) Relate ozone changes to precursor trends and meteorology. • Task 7: Prepare final report and draft manuscript. • Task 8: Provide data, documentation, and software • Task 9: Present findings at meetings
Task 5 Approach • Generate gridded inventories from county-level inventories, 1990 - 2004 • Develop monitor-specific “zone-of-influence” emission trends using 3x3 5x5, and 7x7 arrays of grid cells around each long-term monitor
Task 5 Status • Gridded inventories were generated from county-level inventories and year 2000 surrogate files prepared by STI • Discrepancies identified and revisions made • We created month and year “zone-of-influence” CO, NOx, and NMOC emissions using 3x3, 5x5, and 7x7 arrays of grid cells around each long-term monitor • We are examining current and historical site photos for evidence of changes in land use
Potential Biases in Gridded Emissions(Due to Not Using Historical Surrogates) • Sites located in nonurban settings in 1990 becoming urban by 2000 • Not problematic if site is still nonurban • Not too problematic for trends from 1994-2004 (year 2000 is approximate midpoint) • Relocated sites – must match emissions • Livermore • Folsom • Madera
Candidate Sites: Possible 1990-2004 New Urbanization Within 5 – 10 km • Bethel Island 1990-2004 • Grass Valley 1994-2004 • Cool 1996-2004 • Auburn 1990-2004 • Fresno Sierra Skypark 1992-2004 • Edison 1990-2004 Options: Limit trend comparisons to 1994-2004 and/or adjust gridded emissions on site-specific basis
Task 6 Status • In progress: comparisons of “zone-of-influence” emission trends to ambient primary-pollutant trends • Also in progress: analyses of ozone changes in relation to precursor trends • Completed: analyses of met classes • Completed: analyses of ozone trends at detailed temporal and spatial resolution
Ambient and Emissions Trends for Ozone Precursors • Ambient and emissions trends show discrepancies for NOx when emissions are quantified at county and regional scales • Work in progress: comparisons at smaller spatial scales
Precursor Trends: Regional Scale • We compared ambient precursor decreases to regional emissions decreases • Combined subregions (2 to 6 counties): • Sacramento + N Sierra Foothills • East Bay + South Bay + SF (central Bay area) • N San Joaquin + S Sierra Foothills • Central San Joaquin + S San Joaquin
Ambient-emissions NOx discrepancy exists for central Bay and Sacramento areas
Why aren’t the ambient NOx trends at some sites as large as expected from the emission trends? Working hypothesis: Diesel NOx emissions have not decreased To be determined: are there discrepancies between ambient and near-site emissions trends?
Ozone Trends: Spatial and Temporal Patterns of Changes
Ozone concentration surfaces show changes in frequencies of high-ozone days over time – but some sites show more high-ozone days in later years
Peak 8-Hour Ozone 80-120 ppbv 40-80 ppbv
Peak 8-Hour Ozone 80-120 ppbv 40-80 ppbv
Peak 8-Hour Ozone 80-120 ppbv 40-80 ppbv
Peak 8-Hour Ozone 80-120 ppbv 40-80 ppbv
Peak 8-Hour Ozone 80-120 ppbv 40-80 ppbv
Peak 8-Hour Ozone 80-120 ppbv 40-80 ppbv
Peak 8-Hour Ozone 80-120 ppbv 40-80 ppbv
From Tracy to Yosemite ….. …..a transect analysis
Peak ozone increases from Tracy to Merced, then declines … Jerseydale and Yosemite are less influenced by fresh emissions Means by hour, determined from top 60 peak ozone days
Mean ozone at Tracy declines between 1995-99 and 2000-2004 during almost all hours
Also, mean ozone at Modesto declines between 1995-99 and 2000-2004 from 8 am through 7 pm
And … Modesto-Tracy differences similar between 1995-99 and 2000-2004 (except from 6 am through 11 pm)
But … the Turlock-Modesto difference increases between 1995-99 and 2000-2004 during all hours
And … the Merced-Turlock difference increases between 1995-99 and 2000-2004 during almost all hours
Yet … the Jerseydale-Merced difference declines between 1995-99 and 2000-2004 during all hours
How Does Northern SJV Ozone FormationIn 2000-04 Compare With1995-99? • Lower at western boundary – ozone declined at Tracy and Modesto • Decreased overall – indicated by declines at Jerseydale - reflect outflow and probably also aloft concentrations • Increased within parts of the northern SJV – as shown by intersite differences that are larger in later years