Download
1 / 20
200 likes | 374 Views
Understanding visual map formation through vortex dynamics of spin Hamiltonian models. Myoung Won Cho ( mwcho@snu.ac.kr ) BK21 Frontier Physics Research Division department of Physics & Astronomy Seoul National University. Functional maps in the brain. Somatosensory cortex. Motor cortex.

E N D
Understanding visual map formation through vortex dynamics of spin Hamiltonian models Myoung Won Cho (mwcho@snu.ac.kr) BK21 Frontier Physics Research Division department of Physics & Astronomy Seoul National University
Functional maps in the brain Somatosensory cortex Motor cortex Orientation preference map Primary visual cortex (V1) Primary auditory cortex (A1) Ocular dominance map
Orientation preference (OP) map in V1 Smoothly varying OPs in an array Pinwheel (singular point) Linear zone (periodic patterns) Optical imaging technique reveals the detailed whole feature of visual cortex OP map of tree shrew (Bosking et al 1997)
Ocular dominance (OD) map in V1 Ocular (left or right eye) dominance column The structure of the primary visual cortex
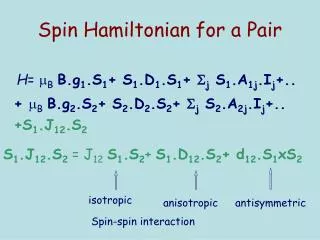
Spike-like Hamiltonian model of OP and OD maps J(x,y) = J(|x-y|) :Mexican hat type Red : external stimuli B(x) Blue : neighbor interactions through lateral connections J(x,y) where Si = (Six,Siy)=(cos 2fi, sin 2fi ) for preferred angle fi or Si = (Siz) for ocular dominance Siz k : degree of negative interactions
There are so many models which can lead successful visual map • formations. • ex) Miller’s correlation-based model, Spin-like Hamiltonian model, • Kohonen’s SOFM, Elastic net model, … • It may be needed to determine the proper model by comparing with • more detailed experimental data. • (Erwin et al. 1995, Swindale 1996) • However, we cannot determined the proper one by comparing with simulation results because the statistical characteristics of visual maps do not originate from the unique neural mechanisms. • (Cho & Kim, 2005)
Universal theory of cortical map formations Cho & Kim PRL (2005)
What determines the typical characteristics of cortical maps?
The typical characteristics of cortical maps are determined by the topologic properties of lattice and phase space rather than detailed neural interaction or learning rules. They share the statistical properties with other physical systems having the same topology: OD map => Ising spin model (O(1) symmetry) OP map => XY spin model (O(2) symmetry) OP+OD map => Heisenberg spin model (O(3) symmetry)
Pinwheels in OP map ≡ Vortices in XY spin system (Singularities in 2D lattice systems having O(2) symmetry) (Wolf & Geisel, Nature, 1998)
Emergence of periodic patterns by large inhibitory connections between long-distance neurons Autocorrelation function of preferred orientation in Macaque (Obermayer 1993)
Perpendicularity at cortical boundary OP map of tree shrew Electrostatic fields near conductor or OD map of macaque monkey
Correlation between OP and OD maps Experimental results show OP and OD maps are correlated - contour lines intersect perpendicularly - island structures in OD map locate near the singularity of OP map OP <Experimental data> OD
l=0.62 l=0.65 l=0.62 l=0.65 Competitive relationship between OP and OD components => Development of strong OD components near pinwheels <= No periodic pattern because of weak negative interactions Anisotropy l ~ JOD / JOP
Different OD map formations depending on the anisotropyl XY model region Pure Heisenberg model region OD segregation strength Out-of-plane vortex unstable Ising model region Cho & Kim, PRL(2005)
Three typical visual map types observed in different animals < Cat > - island patterns in OD maps - intermediate OD segregation < Macaque Monkey > - Stripe patterns in OD maps - Strong OD segregation < Tree Shrew > - Weak OD segregation (no OD map) - Strong orientation selectivity
Pinwheel stability depending on the anisotropyl (Wolf & Geisel, Nature, 1998)
< Summary > • - Collective behaviors in a cortex system can be clarified by the general principles in statistical mechanics in spite of unique neural mechanisms and complex cortical structures. • Symmetry property is one of the keywords to understand collective behaviors in a neural system like other physical systems.