
Introduction
No. 098. A pilot study to assess the relationship between ADC values and Gleason scores in prostate cancer: Implications for a Gleason score predictor. Luke Waldron; Alain Lavoipierre ; Mark Frydenberg ; Dean Federman ; Andrew Ryan; David Di Domenico. Posters Proudly Supported by:.

Introduction
E N D
Presentation Transcript
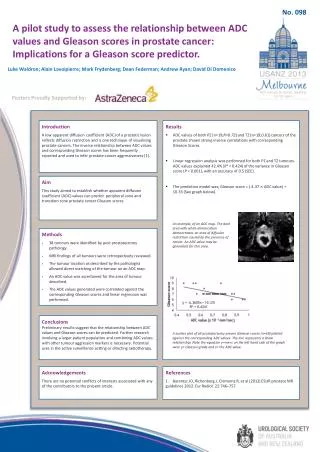
No. 098 A pilot study to assess the relationship between ADC values and Gleason scores in prostate cancer: Implications for a Gleason score predictor. Luke Waldron; Alain Lavoipierre; Mark Frydenberg; Dean Federman; Andrew Ryan; David Di Domenico Posters Proudly Supported by: • Results • ADC values of both PZ (n=19;R=0.72) and TZ (n=19;0.61) cancers of the prostate shown strong inverse correlations with corresponding Gleason Scores. • Linear regression analysis was performed for both PZ and TZ tumours. ADC values explained 42.4% (R2 = 0.424) of the variance in Gleason score (P < 0.001), with an accuracy of 0.5 (SEE). • The prediction model was; Gleason score = (-4.37 ADC value) + 10.33 (See graph below). Introduction A low apparent diffusion coefficient (ADC) of a prostatic lesion reflects diffusion restriction and is one technique of visualising prostate cancers. The inverse relationship between ADC values and corresponding Gleason scores has been frequently reported and used to infer prostate cancer aggressiveness [1]. Aim This study aimed to establish whether apparent diffusion coefficient (ADC) values can predict peripheral zone and transition zone prostate cancer Gleason scores. An example, of an ADC map. The dark area with white demarcation demonstrates an area of diffusion restriction caused by the presence of cancer. An ADC value may be generated for this area. • Methods • 38 tumours were identified by post prostatectomy pathology. • MRI findings of all tumours were retrospectively reviewed. • The tumour location as described by the pathologist allowed direct matching of the tumour on an ADC map. • An ADC value was ascertained for the area of tumour described. • The ADC values generated were correlated against the corresponding Gleason scores and linear regression was performed. Conclusions Preliminary results suggest that the relationship between ADC values and Gleason scores can be predicted. Further research involving a larger patient population and combining ADC values with other tumour aggression markers is necessary. Potential uses in the active surveillance setting or directing radiotherapy. Ascatter plot of all prostatectomy proven Gleason scores (n=38) plotted against the corresponding ADC values. The line represents a linear relationship. Note the equation y=mx+c on the left hand side of the graph were y= Gleason grade and x= the ADC value. Acknowledgements There are no potential conflicts of interests associated with any of the contributors to the present article. • References • 1. BarentszJO, Richenberg J, Clements R, et al (2012) ESUR prostate MR guidelines 2012. EurRadiol. 22:746–757.


