
Uploaded by
porter-wright
4 SLIDES
101 VIEWS
40LIKES
Chromatin Modification Effects on RNA Polymerase and Capping Enzyme Dynamics
DESCRIPTION
Investigating the impact of chromatin modifications on RNA polymerase and capping enzyme interactions and occupancy in yeast.
Download
1 / 4
Download Presentation 
Chromatin Modification Effects on RNA Polymerase and Capping Enzyme Dynamics
An Image/Link below is provided (as is) to download presentation
Download Policy: Content on the Website is provided to you AS IS for your information and personal use and may not be sold / licensed / shared on other websites without getting consent from its author.
Content is provided to you AS IS for your information and personal use only.
Download presentation by click this link.
While downloading, if for some reason you are not able to download a presentation, the publisher may have deleted the file from their server.
During download, if you can't get a presentation, the file might be deleted by the publisher.
E N D
Presentation Transcript
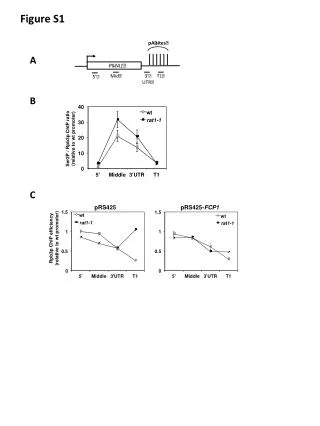
Figure S1 A B Ser2P / Rpb3p ChIP ratio (relative to wt promoter) C pRS425 pRS425-FCP1 Rpb3p ChIP efficiency (relative to wt promoter)
Figure S2 RPB1 rpb1-N488D A Ser2P ChIP efficiency (relative to wt promoter) RPB1 rpb1-N488D B Ser2P / Rpb1p ChIP ratio (relative to wt promoter) C Relative Rpb1p occupancy
Figure S3 A rat1-1 rat1-1 ChIP Fcp1-myc (% Input) B Ctk1-HA Fcp1-myc Ctk1-HA / Rpb3 ChIP ratio Fcp1-myc / Rpb3 ChIP ratio
Figure S4 pRS315 rat1-D235A pRS315 rat1-1 rat1-1 wt wt Ser2P Rpb1p (H5) Total Rpb1p (Y-80)


More Related