Receiver Operator Characteristics
300 likes | 439 Views
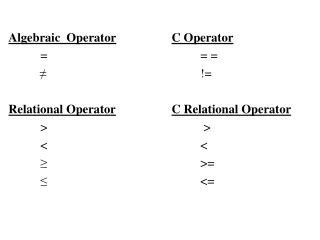
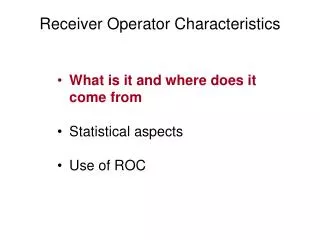
Receiver Operator Characteristics. What is it and where does it come from Statistical aspects Use of ROC. Early radar signals. Is this an enemy plane?. Signal Noise Ratio. The problems of decision. Sound the alarm when the signal is very small Advantages

Receiver Operator Characteristics
E N D
Presentation Transcript
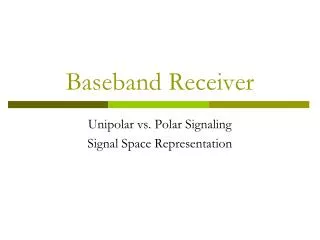
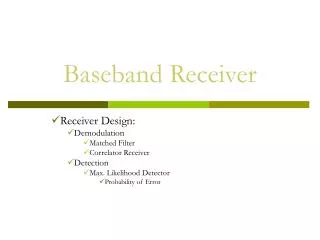
Receiver Operator Characteristics • What is it and where does it come from • Statistical aspects • Use of ROC
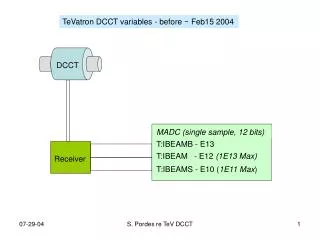
Early radar signals Is this an enemy plane? Signal Noise Ratio
The problems of decision • Sound the alarm when the signal is very small • Advantages • Plenty of time to get the fighters off the ground • Reduce the number of bombers reaching the target • Disadvantages • Lots of false alarms • Waste of gasoline, wear and tear on fighter planes • Exhaust fighter pilots • Sound the alarm when the signal is unmistakable • Advantages • No waste, no wear and tear, no exhaustion • Disadvantages • More bombers get through, more bombs, more destructions
Solution to decisions • Code Yellow • Signal suggests possible incoming bomber • Pilots get dressed, fighter planes get loaded with gasoline and ammunition • Code Orange • Signal suggests incoming bomber likely • Fighter planes towed to runway, pilots goes to the planes • Code Red • Signal is unmistakable • Fighter planes take off
Receiver Operator Characteristics Perfect operator 100% Sensitive 0% false alarms Most operators Sensitivity Useless operator Sensitivity and false alarm rate changes together False alarms
Code Yellow Code Orange Code Red Sensitivity False alarms Receiver Operator Characteristics Increasing signal strength
Code Yellow Code Orange Code Red Sensitivity False alarms Receiver Operator Characteristics Increasing signal strength
Receiver Operator Characteristics • What is it and where does it come from • Statistical aspects • Use of ROC
Statistical ROC • A measurement is normally distributed in two groups, those outcome negative and those outcome positive • Using a cut off level to make a decision will create a number of TP, FN, FP, and TN. From these Sensitivity and Specificity is calculated • If the cut off value changes • TP,FN,FP,TN changes • Sensitivity and Specificity changes • The relationship between Sensitivity and Specificity over the range of the measurement defines the ROC
Receiver Operator Characteristics • What is it and where does it come from • Statistical aspects • Use of ROC
Advantages of using ROC • It defines the quality of a test or prediction using a measurement without specifying a cut off value for decision making • Assuming Normal distribution • The mean and Standard Error can be estimated • The 95% CI can be estimated • Statistical significance can be determined • Whether one test is better than another can be determined
چهار ترکیب ممکن برای تصمیم و خطا • مثبت نادرستFP : درصد افراد غیر مبتلا که مدل تصمیم به اشتباه آنها را مبتلا تشخیص داده است. • منفی نادرستFN : درصد افراد مبتلا که مدل تصمیم به اشتباه آنها را غیرمبتلا تشخیص داده است. • منفی درستTN : در صد افرادی غیر مبتلا که مدل تصمیم به درستی آن را تشخیص داده است. • مثبت درستTP : درصد افرادی که بیماری دارند و مدل تصمیم به درستی آن را تشخیص داده است. TP+FN=100% FP+TN=100% هدف مدل تصمیم حداقل کردن خطاهاست) FPو FN(
نکته • درصد FN و FP به صورت مستقل حداقل نمیشود • اگر FP کم شود FN افزایش می یابد و برعکس • نمودار ROC مقدار بهینه را پیدا می کند.
مثال: هدف تشخیص فشار خون بالا در افراد است. برای انجام این کار فشار خون افراد در سه گروه فرضی اندازهگیری می شود. 1- جمعیت سالم که تحت مراقبت قرار گرفتهاند. 2- جمعیت بیماران مشمول مراقبت اولیه که به خاطر شکایات جزئی تحت بررسی هستند. 3- جمعیت بیمارانی که در بخش قلبی بستری هستند.