Download
1 / 21
210 likes | 382 Views
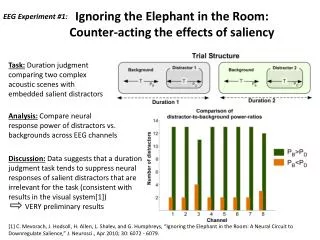
The effects of fatigue on Counter Movement jump squats . Prepared by Justin Wolfe, Yann Lacoste and Pat Nolan. Table of contents. Hypothesis Running the Test Data Collection Methods Results and Data Analysis Sources of Error Increasing Accuracy of Testing. Hypothesis.

E N D
The effects of fatigue on Counter Movement jump squats Prepared by Justin Wolfe, Yann Lacoste and Pat Nolan
Table of contents • Hypothesis • Running the Test • Data Collection Methods • Results and Data Analysis • Sources of Error • Increasing Accuracy of Testing
Hypothesis • Fatigue does indeed affect jump height, and considering that fatigue is brought on by a minute of continuous jumps, we believe that the closer to the minute mark the test subject gets, the more fatigued he will become and subsequently, the lower his jump height will be.
Running the test • Two jumpers • One set each of 1:00min max countermovement jump squats • Recording using an IPhone 4S • Both jumpers filmed in the P.IS.E. Gym Test subject A
Data collection methods • Kinovea
Analyzing data • Measurement of Max Knee Angle • Measured Take Off Time and Landing Time for each jump to determine Flight Time • Jump Heightformula =-(-9.81*flight time^2)/8 • AND statement to determine if Knee Angle between 75-115
results • 44 jumps for Jumper A, and 43 jumps for Jumper B • Confirmed Hypothesis • Jumper A (Justin) average of the first 10 jumps =0.40maverage of the last 10 jumps = 0.26 meters • Jumper B (Yann) average for the first 10 jumps = 0.32mAverage of the last 10 jumps =0.12m
yann’sperformance analysis Jump Height Analysis of Jumper B
Correlation coefficient • A value of 1 means that a linear equation describes the relationship between X and Y perfectly, with all data points lying on a line for which Y increases as X increases • Strong correlation in between 0.5 to 1.0 Jumper A: R² = 0,85553 Jumper B: R² = 0,86561
Results cont. Jumper A Results Jumper B Results
Sources of potential error • Free-hand filming • Slight changes from jumper A to jumper B • Distance from jumper to cameraman • Difficult to measure sideways data • “Cheating” the results • Measuring by flight time
Increasing accuracy • Use higher quality camera • Ex. High-Speed camera (Quarter of a million frames per second) • Better video editing software • Give more precise numbers with more accurate analysis • Use joint markers • Help in assuring measurements are accurate
Conclusion • We have found that fatigue does indeed impact jump height. Hypothesis confirmed • Squat jumps for a minute straight are incredibly painful