Download

1 / 7
0 likes | 11 Views
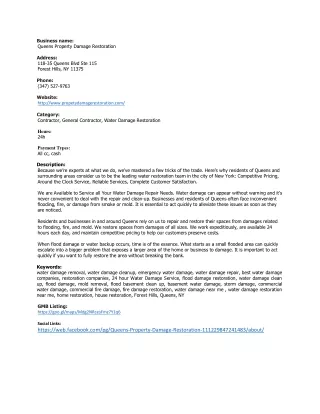
This study investigates the correlation between γH2AX and pRPASer4/8 foci in response to Rucaparib treatment in various cancer cell lines. Cell survival rates and LC50 values for Rucaparib and checkpoint kinase inhibitors such as VE-821, PF-477736, and MK-1775 are analyzed. The potentiation effects of combining these agents are explored through colony formation assays. Additionally, the impact on cell cycle progression and DNA damage repair markers like RAD51 foci are evaluated through cell cycle analysis. Results indicate potential synergistic effects and alterations in DNA damage response pathways.

E N D
A) B) Correlation of H2AX and pRPA foci/cell 100 Cell survival at 10 M rucaparib 40 Mean pRPASer4/8 foci/ cell 80 p= 0.0003 *** (% control) 30 60 20 40 10 20 p<0.001 0 0 0 5 10 15 20 25 IGROV-1 C33A V-C8.B2 UWB UWB +B1 SiHa Mean γH2AX foci/ cell C) D) Cell line Mean LC50 ± S.D Rucaparib [µM] VE-821 [µM] PF-477736 [nM] MK-1775 [nM] C33A 8.0 ± 1.2 1.7 ± 0.3 140.4 ± 23.0 254.7 ± 35.2 SiHa 8.2 ± 2.1 1.6 ± 0.6 125.5 ± 53.9 339.3 ± 40.2 IGROV-1 11.7 ± 0.3 1.8 ± 0.5 22.4 ± 0.9 121.4 ± 28.7 UWB+B1 12.3 ± 3.2 1.6 ± 0.6 43.7 ± 11.0 207.2 ± 8.0 UWB 0.19 ± 0.01 0.6 ± 0.09 27.3 ± 8.8 151.6 ± 33.9 V-C8.B2 8.8 ± 0.5 2.1 ± 0.2 87.5 ± 63.8 372.1 ± 150.2 V-C8 0.01 ± 0.003 1.9 ± 0.1 100.9 ± 36.3 454.5 ± 98.5 E) 1 µM VE-821 50 nM PF-477736 100 nM MK-1775 Supplementary figure 1. A. Colony formation-based cell survival following exposure of cells to 10 µM rucaparib for 24 h. Data, percent survival relative to vehicle (DMSO) control are 3 independent experiments. B. Correlation of mean pRPAS4/8 foci/cell with mean γH2AX foci/cell. Mean value was from 3 independent experiments and significance was calculated in Graph pad Prism 9.0. C. Scatter plots of γH2AX foci/cell values for 3 independent experiments for all cells except UWB, where each column represents an individual experiment. Collated data is shown in Figure 1C. Significance of increase from DMSO control cells to those treated with 10 µM rucaparib was calculated with Graph pad Prism 9.0 * p<0.05, ** p<0.01, *** p<0.0001. D. Mean LC50 data for rucaparib, VE-821, PF-477736 and MK-1775, calculated from data shown in Fig 1A and Fig 3A following exposure to compounds for 24 h. Data are mean ± SEM of 3 independent experiments. E. The mean survival of cells (% control) was calculated from single agent checkpoint kinase inhibitor cytotoxicity data, with the view of use in combination studies, whilst ensuring limited excessive toxicity. Data are mean ± SEM of 3 independent experiments.
A) C33A SiHa IGROV-1 UWB+B1 V-C8.B2 Rucaparib single agent Mean cell survival at 10 µM rucaparib (%) ± S.D 24.0 ± 5.1 45.9 ± 15.2 52.1 ± 0.8 48.3 ± 4.2 45.6 ± 3.9 Mean cell survival at 10 µM rucaparib (%) ± S.D 12.7 ± 6.8 17.1 ± 9.7 33.2 ± 4.4 26.6 ± 5.3 10.0 ± 3.7 + 1 µM VE- 821 Mean potentiation factor ± S.D 2.5 ± 2.0 3.5 ± 2.9 1.6 ± 0.2 1.8 ± 0.2 5.1 ± 1.9 Mean cell survival at 10 µM rucaparib (%) ± S.D 8.4 ± 6.9 20.9 ± 2.8 32.3 ± 1.8 42.7 ± 6.1 15.4 ± 3.6 + 50 nM PF- 477736 Mean potentiation factor ± S.D 3.9 ± 1.9 2.2 ± 0.6 1.6 ± 0.1 1.1 ± 0.2 3.0 ± 0.5 Mean cell survival at 10 µM rucaparib (%) ± S.D 10.3 ± 5.6 24.9 ± 0.8 25.6 ± 2.7 25.1 ± 8.0 14.9 ± 3.5 + 100 nM MK-1775 Mean potentiation factor ± S.D 2.6 ± 0.8 1.9 ± 0.7 2.1 ± 0.2 2.1 ± 0.7 3.2 ± 0.9 B) AUC values of HRP cell lines 2000 rucaparib rucaparib+ VE rucaparib+ PF rucaparib+ MK 1500 * AUC ** *** ** * 1000 * * ** * * * * ** * ** ** * * * ** 500 * * * 0 UWB+B1 V-C8.B2 C33A SiHa IGROV-1 Supplementary figure 2. A. .Cells were exposed to rucaparib at indicated concentrations either as single agent or with the addition of 1 µM VE-821, 50 nM PF-477736 or 100 nM MK-1775 for 24 h prior to replacement with drug- free medium for 8-12 days to allow colony formation. Potentiation factor was calculated at by dividing mean % cell survival at 10 µM rucaparib single agent by mean % cell survival at 10 µM rucaparib with the addition of 1 µM VE- 821, 50 nM PF-477736 or 100 nM Mk-1775. Data are mean ± SEM of 3 independent experiments. B. Area under curve (AUC) values were calculated with Graph pad Prism 9.0 software and data are the mean ± SEM of 3 independent experiments. Statistical analysis of the difference in AUC values between rucaparib single agent and with combination of VE-821, PF-477736 or MK-1775 was calculated with Graph pad Prism 9.0, * p<0.05, ** p<0.01, *** p<0.0001.
A) B) Supplementary figure 3. A. Histogram plots and B. density plots of cell cycle analysis of human ovarian cancer IGROV-1 and UWB paired cells following 24 h exposure to rucaparib single agent and in combination with VE-821 (1 µM), PF-477736 (50 nM) and MK-1775 (100 nM). Collated data of 3 independent experiments in IGROV-1 cells and mean of 2 independent experiments in UWB paired cells mean± SEM of is shown in figure 4A.
A) RAD51 foci in UWB1.289+ B1 cells 40 RAD51 foci/damaged cell 30 20 10 0 rucaparib+ MK-1775 rucaparib+ PF-477736 rucaparib+ VE-821 rucaparib DMSO RAD51 foci in C33A cells γH2AX foci in C33a cells **** 60 200 RAD51 foci/damaged cell **** ns 150 γH2AX foci/cell 40 ns 100 20 50 nsns 0 0 rucaparib+ PF-477736 rucaparib + MK-1775 rucaparib+ PF-477736 rucaparib + MK-1775 rucaparib+ VE-821 rucaparib+ VE-821 rucaparib DMSO rucaparib DMSO B) Supplementary figure 4. Scatter plots showing individual experiments pooled in figure 4B-D, with each column representing an independent experiment in A. UWB+B1, UWB, C33A, SiHa and IGROV-1 human cell lines and B. mouse fibroblast V-C8 paired cells. 3 independent experiments are shown in cells treated with 10 µM rucaparib single agent and with the addition of 1 µM VE-821, 50 nM PF-477736 or 100 nM MK-1775 for 24 h prior to fixation.
Supplementary figure 5. Scatter plots showing γH2AX and RAD51 foci/cell in patient-derived ascites samples. Data of mean foci/cell are shown in figure 5G. Data are one experiment per primary culture.
500 2.5 A) V-C8.B2 400 2.0 V-C8.B2 V-C8 SiHa V-C8 IGROV-1 UWB+B1 AUC VE-821 IGROV-1 LC50 VE-821 C33A UWB+B1 300 1.5 SiHa C33A UWB 200 1.0 R2= 0.3 p= 0.2 R2= 0.2 p= 0.3 UWB 100 0.5 0 0.0 0 5 10 15 20 0 5 10 15 20 Baseline γH2AX Baseline γH2AX 15000 150 C33A C33A V-C8.B2 LC50 PF-477736 AUC PF-477736 SiHa V-C8 10000 100 V-C8 SiHa V-C8.B2 UWB+B1 IGROV-1 5000 50 R2= 0.07 p= 0.6 R2= 0.06 p= 0.6 UWB UWB+B1 UWB IGROV-1 0 0 0 5 10 15 20 0 5 10 15 20 Baseline γH2AX Baseline γH2AX 500 80000 V-C8 400 V-C8.B2 LC50 MK-1775 V-C8.B2 60000 AUC MK-1775 SiHa V-C8 300 SiHa UWB C33A IGROV-1 40000 200 C33A UWB+B1 UWB R2= 0.02 p= 0.8 R2= 0.01 p= 0.8 UWB+B1 20000 IGROV-1 100 0 0 0 5 10 15 20 0 5 10 15 20 Baseline γH2AX Baseline γH2AX 2.2 450 B) V-C8.B2 400 SiHa 2.0 V-C8.B2 LC50 VE-821 IGROV-1 AUC VE-821 UWB+B1 350 R2= 0.5 p= 0.2 1.8 IGROV-1 300 C33A R2= 0.1 p= 0.5 1.6 UWB+B1 250 SiHa C33A 1.4 200 0 1 2 3 4 0 1 2 3 4 Baseline γH2AX Baseline γH2AX 150 15000 C33A C33A LC50 PF-477736 SiHa AUC PF-477736 V-C8.B2 100 10000 SiHa V-C8.B2 UWB+B1 50 IGROV-1 5000 R2= 0.00 p= 0.9 UWB+B1 R2= 0.07 p= 0.7 IGROV-1 0 0 0 1 2 3 4 0 1 2 3 4 Baseline γH2AX Baseline γH2AX 80000 400 V-C8.B2 V-C8.B2 60000 SiHa 300 AUC MK-1775 SiHa LC50 MK-1775 V-C8 C33A UWB IGROV-1 40000 200 UWB+B1 C33A IGROV-1 R2= 0.04 p= 0.7 R2= 0.01 p= 0.8 UWB+B1 20000 100 0 0 0 1 2 3 4 0 5 10 15 20 Baseline γH2AX Baseline γH2AX Supplementary figure 6. Assessing basal RS (γH2AX) as a determinant of sensitivity to single agent VE-821, PF- 477736 and MK-1775 with A. all cell lines including HRD UWB and V-C8 cells and B. HRP cell lines, by correlating mean basal γH2AX with LC50 and AUC values of single agent checkpoint kinase inhibitors. Data are mean of 3 independent experiments.
VE-821 PF-477736 Fold-sensitisation from A.U.C Fold-sensitisation from A.U.C 4 5 V-C8.B2 C33A 4 SiHa 3 SiHa 3 UWB+ B1 C33A UWB+ B1 2 IGROV-1 V-C8.B2 2 1 IGROV-1 1 p=0.02 p=0.001 0 0 0 2 4 6 8 10 0 2 4 6 8 Fold-inhibition of HRR Fold-inhibition of HRR MK-1775 Fold-sensitisation from A.U.C 4 3 V-C8.B2 C33A 2 SiHa IGROV-1 UWB+ B1 1 p=0.003 0 0 2 4 6 Fold-inhibition of HRR Supplementary figure 7. Fold-sensitisation of HRP cells by addition of 1 µM VE-821, 50 nM PF-477736 and 100 nM MK-1775 as determined from AUC values vs fold-inhibition of HRR caused by the addition of each of the checkpoint kinase inhibitors. Data plotted are mean of 3 independent experiments.