Input and Output I: ASCII and Binary files
130 likes | 374 Views
Input and Output I: ASCII and Binary files. Data formats. ASCII Binary netCDF HDF. Write to screen. Syntax: print, arg 1 , arg 2 , …, arg n print, arg 1 , arg 2 , …, arg n , format=‘(format code)’ print, arg 1 , arg 2 , …, arg n , format=‘(N(format code))’

Input and Output I: ASCII and Binary files
E N D
Presentation Transcript
Data formats • ASCII • Binary • netCDF • HDF
Write to screen • Syntax: print, arg1, arg2, …, argn print, arg1, arg2, …, argn, format=‘(format code)’ print, arg1, arg2, …, argn, format=‘(N(format code))’ • Format codes (iN, fN.M, eN.M, aN) print, !pi, format=‘(i1)’ print, !pi, format=‘(f5.2)’ print, !pi, format=‘(e6.2)’ print, string(!pi, format=‘(a5)’) • Notes on format codes: 1) Always used from left to right 2) If there are more codes than values, the left codes are not used 3) If there are less codes than values, then after all codes are used, a new line is printed and the codes are repeated
Read from keyboard • Syntax: read, arg1, arg2, …, argn read, arg1, arg2, …, argn, format=‘(format code)’ read, arg1, arg2, …, argn, format=‘(N(format code))’ • Note: Please remember to define the variables before using them to read in data
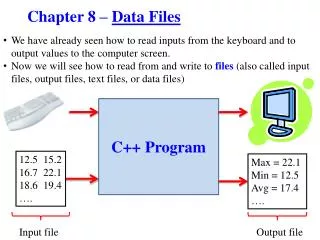
Open/close a file • Two types of files: Formatted: ascii format Unformatted: binary format • Open a file for read only: openr, lun, filename (lun is the logical unit number, could be set as 1-99) openr, 5, ‘test.dat’ • Open a file for read or write: openw, lun, filename • Close a file: Please remember to close a file after finishing reading/writing close, lun • Check for end-of-file: eof(lun) (=1, end; =0 not end)
Reading and writing ascii files • Syntax: readf, lun, arg1, arg2, …, argn, format=‘(format code)’ printf, lun, arg1, arg2, …, argn, format=‘(format code)’ • Example p=1000.0 T=29.5 openw, 1, ‘t.dat’ printf, 1, ‘Pressure’, p, ‘Temperature’, T, format=‘(a15, f8.1, a15, f8.1)’ close, 1 a2=‘ ’ b2=‘ ’ p2=0.0 t2=0.0 openr, 2, ‘t.dat’ readf, 2, a2, p2, b2, t2, format=‘(a15, f8.1, a15, f8.1)’ print, a2, p2, b2, t2 close, 2
Check if you read the data correctly • Print the value of one variable • Print the maximum, minimum, mean, median values • Plot the time series • Plot spatial distribution along a longitude or latitude or height • Plot horizontal distribution using contour map
Reading/writing binary files • Syntax: readu, lun, arg1, arg2, …, argn (compatible w/ Fortran-77 unformatted direct access mode) readu, lun, arg1, arg2, …, argn, /f77_unformatted (compatible w/ Fortran-77 unformatted sequential access mode) • To read portable binary file: add /xdr readu, lun, arg1, arg2, …, argn, /xdr If you don’t know if the data file is in portable format or not, you can try adding/removing /xdr • Note: Binary format is generally machine-dependent, so please try to avoid writing data into binary files. You can use netCDF files instead if you want to reduce the file size.
Contour Syntax: contour, d, x, y x(nx) x ordinate y(ny) y ordinate d(nx, ny) data array contour, d (the data points are plotted against corresponding array indices)
Contour customization Keywords
xyouts Syntax: xyouts, x, y, string where x is x ordinate y is y ordinate string is the string you want to overplot
In-class assignment V Data files are stored at: http://lightning.sbs.ohio-state.edu/geo820/data/ • Read the ascii file sonde.ascii for sounding data from tropical station Chuuk. Read and plot the profiles of pressure (pres), height (hght), temperature (temp), and mixing ratio (mixr) for the first sounding • (Bonus) Could you find a way to automatically read all the soundings in this file? • Read the binary file precip.bin for GPI global satellite precipitation data. The readme file is precip.readme. Note you may need to check if it is in portable format. Use different methods to check if you read the data correctly. • Make a contour plot of the long-term mean of GPI global precipitation. Use xyouts to show the location of Columbus, OH