Download

1 / 43
900 likes | 2.74k Views
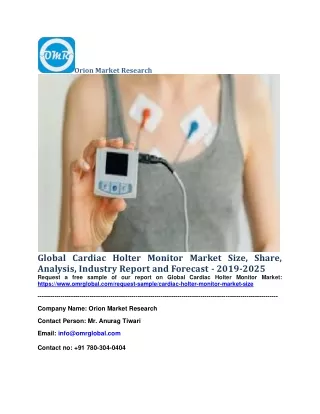
Holter Training. Edan Instruments, Inc. www.edan.com.cn info@edan.com.cn Mar . 1, 2016. What is Holter?. Holter (ambulatory electrocardiography, AECG ) is a portable device for continuously monitoring various electrical activity of the cardiovascular system for at least 24 hours.

E N D
Holter Training Edan Instruments, Inc. www.edan.com.cn info@edan.com.cn Mar. 1, 2016
What is Holter? Holter (ambulatory electrocardiography, AECG) is a portable device for continuously monitoring various electrical activity of the cardiovascular system for at least 24 hours. • Advantage of Holter • Continuously Monitoring • Long-time Sampling • Non-invasive test • Doesn’t affect patient’s daily life • Riskless and painless
How to proceed a Holter Monitoring? 3. Conduct your normal activities while wearing the Holter. 5. When the data measurement period is over, return the device. 1. Schedule an appointment with the cardiologist to get the monitor. 4. You may take notes to mark the events like feeling dizzy or chest pain. 2. Attach the Holter. Typically, a monitor is worn for 24 to 72 hours. 6. Your data will be load into the Holter Software and analyzed by doctor.
When does patient need Holter Monitoring? • When patient shows symptoms include chest pains, shortness of breath, palpitations, needs to confirm the cause of the disease. • When patient shows arrhythmia, needs to have the qualitative analysis and quantitative analysis and to evaluate the risk. • When patient shows symptoms of ischemia, needs to have the qualitative analysis and quantitative analysis. • When patient feels angina pectoris, needs to confirm the type of disease and have accessory information of coronary heart disease. • Prognosis evaluation for Myocardial Infraction (MI) patient. • Assessment for Percutenous transluminal coronary angioplasty (PTCA) patient to see if restenosis occurs or not. • Evaluation for Sinus Node function. • Assessment for Pacemaker function. • Evaluation of therapeutic efficiencyof antiarrhythmic anti-myocardial ischemia medicine.
What kind of information can be acquired from Holter Analysis Software? • Anisorhythmia • Sinus Bradycardia • Sinus Tachycardia • Superventricular premature beat (SVE) • Ventricular premature beat (VE) • Bundle Branch Block (BBB) • Asystole/Sinus arrest • Atrial fibrillation/Atrial flutter • Ventricular Tachycardia • ST segment elevation/depression • .......... Based on the analysis of the ECG above and the patient’s other Clinical manifestation, cardiologist deduces the disease of the patient.
What kind of information can be acquired from Holter Analysis Software? • Anisorhythmia Rhythm shows irregular, sometimes varying with respiration.
What kind of information can be acquired from Holter Analysis Software? • Sinus Bradycardia Rhythm shows regular, Heart Rate Slow (< 60 bpm), P Wave Normal
What kind of information can be acquired from Holter Analysis Software? • Sinus Tachycardia Rhythm shows regular, Rate Fast (> 100 bpm), P Wave Normal, may merge with T wave at very fast rates
What kind of information can be acquired from Holter Analysis Software? • Superventricular premature beat (SVE) Premature JunctionalComplex or Premature Atrial Complex, with absent or premature P wave, normal QRS shape but a sudden shorten RR interval,
What kind of information can be acquired from Holter Analysis Software? • Ventricular premature beat (VE) Rhythm shows Irregular, P Wave Absent, QRS Wide (> 0.10 sec), bizarre appearance.
What kind of information can be acquired from Holter Analysis Software? • Bundle Branch Block (BBB) Second Degree Heart Block Type I Rhythm Irregular but with progressively longer PR interval lengthening until a QRS complex is missed. Second Degree Heart Block Type II Rhythm Regular (atrial) and irregular (ventricular) Rate Characterized by Atrial rate usually faster than ventricular rate.
What kind of information can be acquired from Holter Analysis Software? • Bundle Branch Block (BBB) Third Degree Heart Block Rhythm Regular, but atrial and ventricular rhythms are independent. Characterized by Atrial rate usually faster than ventricular rate . First Degree Heart Block Rhythm Regular PR Interval Prolonged (>0.20 sec)
What kind of information can be acquired from Holter Analysis Software? • Asystole/Sinus arrest Asystole Rhythm Not present P Wave Absent QRS Absent Sinus arrest Rhythm Irregular due to pause
What kind of information can be acquired from Holter Analysis Software? • Atrial fibrillation/Atrial flutter Atrial Fibrillation P Wave Absent - erratic waves are present Rate can be very fast (> 350 bpm) Atrial Flutter Rate Fast (250-350 bpm) for Atrial, but ventricular rate is often slower. P Wave Not observable, but saw-toothed flutter waves are present
What kind of information can be acquired from Holter Analysis Software? • Ventricular Tachycardia Rate Fast (100-250 bpm), P Wave Absent, QRS Wide (>0.10 sec), bizarre appearance
1. Load the data Flexible Data Scan • Single input and Batch input • Edan Holter Analysis Software support two methods for data inputting: Single input and Batch input. It automatically searches the data without setting the directory, eliminating tedious tasks. 20 seconds ≤ 70% Single Input Batch Input The software automatically find the Recorder and load one copy of ECG data. The software automatically scan the disk and load all the ECG data. • Fast-loading • EDAN Holter analysis software realizes a very short loading time (less than 8 seconds for 3-channel Data) for one patient data, faster and faster.
2. Select the workflow • Smooth Workflow • The Commonly used functions are placed at the top toolbar to facilitate your workflow. Combining with the auxiliary functions (R-R Histogram, Waveform Superposition), users can experience a very smooth and comfortable workflow. 2 1 4 3 • User-defined toolbar • The top toolbar can be defined by users based on their preference, which brings clinicians a customized workflow. Let the software fit your preference, but not you adapt to the software. 4 3 1 2 The commonly used functions are preset with a user-friendly workflow. You can switch into different analyzing modules with corresponding functions. User-define Toolbar You can also change the preset analyzing modules or create a new module with user-defined functions based on your own practice habit
3. Check the template categorize • Color coded templates classification • Based on the QRS morphology features, beats signal will be automatically categorized as Normal, VE, SVE, Pace, Artifactsand Others, with corresponding color codes. You can notice the segment in one glance. Template Categorize 10 Templates Color coded templates Segment Graph Electrocardiogram
3. Check the template categorize • Sub-templates Classification • Each automatically categorized template is separated into several sets as sub-templates, which brings you multilevel classification for ECG morphologies with organized batching procedures. Sub-QRS classification 10 Templates 1 2 3 4 • Detailed QRS segment • Every single QRS segment is displayed in this area for detailed checking and classification. V • Sub-template • Based on QRS morphology features, each QRS template is divided into sub-templates. This function helps you with multi-level batch modification on QRS categorizing.
3. Check the template categorize The interactive tools provide you with information and control to quickly group beat morphology. • Match QRS by Type • Matching QRS by Type helps to batch categorize QRS complex whose morphology features are similar with the one you confirmed. This is an automatically reverse selection, avoiding manually checking QRS complex one by one. Match QRS By Type 10 Templates Match QRS by Premature % V Del 10 Templates • Match QRS by Premature • By setting the timing advance value, QRS complex can be automatically divided into the higher group and the lower group base on the paling. This function helps to exam ventricular escape and premature ventricular contraction efficiently. Del Artifact 10 Templates • Del Artifact • By selecting a certain segment as artifact, this function helps you to filter out all the artifacts similar with the chosen one in this sub-template group.
3. Check the template categorize • Fast-editing • QRS templates editing is one of the most common operation. Users are able to edit the QRS classification by simply pressing “A/S/V/X/N” buttons on the PC keyboard. Fast editing A S V N X • Format Painter • Use the Format Painter to quickly edit QRS classification by simply select single or batch waveform, which improves your work efficiency to a large extent. Format Painter N S X avP Del A RB V LB En Ea aP Ev vP A fast editing toolbar helps to quickly modify and categories QRS waveforms. While you can also use the keyboard shortcut with QRS Definition. N A vP Del aP Ea En Ev avP RB LB S V X
3. Check the template categorize • Assistant tools for analysis • Finding the distinct waveforms is a time-consuming part of Holter analysis. With the help of a series of assistant tools of EDAN Holter Analysis Software, the process seams to be more than easy to finish. Assistant Tools • R-R Histogram • A group of Interval Histogram is provided an easy access to analyze all the heart beats with different intervals, which helps to quickly locate the infrequent segments and also provides a brief understanding of the patient cardiac condition.
3. Check the template categorize • Assistant tools for analysis • Finding the distinct waveforms is a time-consuming part of Holter analysis. With the help of a series of assistant tools of EDAN Holter Analysis Software, the process seams to be more than easy to finish. Assistant Tools • Waveform Superposition Heat Map • The Waveform Superposition Heat Map shows overlapping waveforms and exposes infrequent segments. This function delivers a quick reference to locate the distinct waveforms for you to review, making your practice more efficient. • Lorenz Plots (Poincare plot) • The Lorenz Plots shows the R-R intervals in a visualized way to quickly indicate the nonhomogeneous beat-to-beat variability. You can also reversely select the distinct plots to view the corresponding waveforms.
3. Check the template categorize • Smart Beats Batch Insert • When it comes with undetected heartbeat, inserting the tag one by one might be an extremely tiresome process. With the help of our Smart Beats Batch Insert function, you can mass insert the tags of undetected heartbeats by referring to another channel of waveform, or by referring to the previous RR intervals of the undetected part. N N N N N Batch Insert Together with the RR Histogram, you can easily find the segments with long RR-intervals which might include undetected heart beat. Using the smart beats batch insert function, you can avoid the undetected errors within several clicks.
4. ST Segment Analysis • Automatic ST Evaluation • The ST Elevation/Deviation can be automatically detected and presented in the ST Evaluation Chart, together with the ST color mapping, you can easily find the targeted segment you need. ST Evaluation • ST Evaluation Chart • Every heart beat is scanned automatically and all the ST elevation/deviation segments are picked and presented in this chart, where you can quickly check and locate the targeted segment. • ST trend Color Mapping • The ST trend Color Mapping shows elevation and deviation in red and green, providing a clear information of ST trend. Integrated with HR trend, it provides a quick reference when evaluate the acute myocardial infarction.
4. AFIB/FLUT Segment Analysis • Automatic AFIB/FLUT Segments detection • The atrial fibrillation/flutter segments also can be automatically detected and presented in the AFIB/FLUT Chart, where you can quickly locate the distinct period of waveforms and check. AFIB/FLUT Evaluation • Auto AFIB Detection Chart • Holter software automatically find the AFIB segments and list them in Chart for you to check. In addition, it support one-button operation to delete SVE in AFIB period, which helps to define the events more accurately. • AFIB/FLUT Histogram • Based on the RR interval distributions, the AFIB/FLUT Histogram helps you to find the distinctive atrial fibrillation/flutter period of waveforms quickly. You can locate the corresponding segment immediately by clicking at the Histogram.
5. Events Summarizing • Real-time updates Events • Every time you modify the QRS tag or define the Event of segment in any interface, the Event Summarizing Chart changes synchronouslywithout any redundant refreshing. VE Runs Events • Event Summarizing Chart • Every segment defined as Event and all the abnormal heart beats are presented in this Chart for reviewing. • The Event Marker recorded by patient is also stored as Diary for reference. • highlighton waveform • The segment defined as Event is highlighted with corresponding mark, which is distinguishable when you scan the waveforms.
6. Page Scan • Intuitive Page Scan • To quick review all the heart beats and double check the abnormal segments, Page Scan is a quiet effective function. You can easily set up the speed, gain and intensity of QRS complex in one page, quickly scanning every heart beat of the patient. Page Scan • Pause Scan Condition • The Page Scan function supports four kinds of “Pause Scan Condition” whose criteria can be fast modified in the toolbar. When it comes with the segments exceeding or going below certain limits, the page scanning will stop for further examining.
7. Report • Built-in Glossary • The built-in ECG glossary consists of rich diagnostic templates with detail feature descriptions and integrated diagnostic results, which helps clinicians draw conclusion effectively and efficiently. Glossary Build-in Glossary • One-button Comments • With the pre-configured report comments built-in, the contents you want to write in the report can be fast addedby pressing only one button. The glossary can also be enriched with user-defined templates, while you can also edit the report manually. Personalized Signature
Why EDAN? With the well-designed workflow and the smart tool/functions, EDAN HolterAnalysis Software helps you save time in every practice. N N N N N Batch Insert Assistant Tools Match QRS By Type 20 seconds 10 Templates ≤ 70% Match QRS by Premature % V Saving 40 seconds in loading data Del 10 Templates Saving 70% of time in templates categorizing Saving 70% of time inmending leak detection Del Artifact 10 Templates Saving 50% of time In finding distinct waveforms
SE-2003&SE-2012 3/12-channel Holter Recorder
Compact & Ergonomics Design • Lightweight Design • The lightweight(50g) design makes EDAN Holter Recorder easily carried without bothering patient’s daily routine. With the smooth surface and the streamline modeling, it fits into the palm perfectly. Smooth edges Pocket Size Compact size Lightweight (50g)
IP27 Waterproof Level IP27 Water & Dust Proof • Great Waterproof Performance • EDAN’s Holter Recorder reaches protection grade up to IP27, intending to prevent unexpected damages from water or dust, which maximizes patients’ freedom in their daily life. The high level waterproofness facilitates the cleaning and sterilization procedure.
Real-time Waveform Display • Real-time Waveform Display • The Recorder applies an OLED Screen, through which you can see the ECG waveforms and wearing time at one glance. It also provides you the interface with several basic settings. • OLED You can have the basic settings without connecting the Recorder with PC, For example: Display • Recording Time • You can select the recording time as 4/3/2/1 days or unlimited until battery off. • Patient ID • Set the patient ID on the recorder. It helps to distinguish the patient when data loaded in the PC.
Auto 3/12-channel Identification • Auto 3/12-channel Identification • SE-2012 supports both 3-channel and 12-channel sampling. With the auto identification of 5/7/12-lead cables, SE-2012 can switch into corresponding sampling mode automatically. 3 2 1 Auto 5/7-lead Electrodes 3-channel ECG 10-lead Electrodes 3/12-channel ECG
Low Power Consumption • Long Time Sampling • EDAN Holter Recorder is designed with low power consumption, which enables it to support as long as 8 daysrecording with a single piece of Li-ion battery. 8 Days
Event Marker • One-button Event Marker • During the sampling, patients may encounter some events like feeling heartache or falling down, which may bring abnormal signals on the waveforms. In this case, by long-pressing the “M” key, an Event Marker will be recorded in the data, which can be distinguished through the software analysis. These recorded information give doctors reference to make precise diagnosis. M Event Marker Find the Event Markers in Events – “Diary”:
Accuracy • Adjustable Sampling Rate • Four sampling rates (128/256/512/1024Hz) are selectable on the Recorder to ensure sampling accuracy under different patient’s conditions. Event Sampling Rate • Interference Resistance • SE-2003/2012 has applied the advanced anti-interference technique and design to guaranteethe accurate ECG signal and the performance of interference resistance. • Pacemaker Detection • EDAN applies the advanced technique of Multi-channel Pacemaker detection by using the special Hardware design. Combining with the software pacemaker analysis, no beats would be missed, which brings doctors confidence on making diagnosis. P Interference Resistance Pacemaker Detection
Highlights of SE-2003/SE-2012 Sampling Box Event 3 2 1 • OLED Sampling Rate M Auto 8 Days Event Marker Display IP27 Pocket Size Water & Dust Proof P Interference Resistance Pacemaker Detection
Highlights of EDAN Holter Analysis Software Flexible Data Scan VE Runs Fast editing Sub-QRS classification N N N N N 10 Templates A S 1 2 Glossary Page Scan V N X AFIB/FLUT Evaluation ST Evaluation Events 2 3 4 Batch Insert Assistant Tools Match QRS By Type 20 seconds 10 Templates ≤ 1 4 Build-in Glossary Format Painter 70% 3 Match QRS by Premature % V V Del 4 10 Templates 10 Templates 3 1 2 User-define Toolbar Del Artifact Color coded templates 10 Templates Personalized Signature
THANK YOU Edan Instruments, Inc. www.edan.com.cn Info@edan.com.cn June. 7, 2016