Download
1 / 29
300 likes | 323 Views
Climate Predictability Tool (CPT) is user-friendly software for creating downscaled seasonal climate predictions. It offers various verification measures like Heidke Skill Score and Pearson correlation to assess forecast accuracy and relationships between variables. Understanding and utilizing these measures is crucial in climate forecasting.

E N D
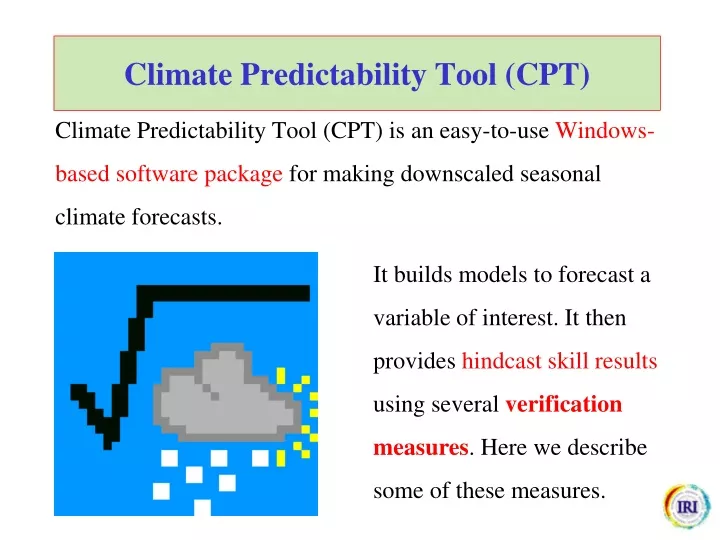
Climate Predictability Tool (CPT) Climate Predictability Tool (CPT) is an easy-to-use Windows-based software package for making downscaled seasonal climate forecasts. It builds models to forecast a variable of interest. It then provides hindcast skill results using several verification measures. Here we describe some of these measures.
Verification of climate forecasts How is forecast skill or accuracy measured? Several measures are commonly used.
Heidke Skill Score (for deterministic categorical forecasts) Probability forecasts for 3 tercile-based categories can be scored as if scored as if they are simple forecasts for category having the highest probability. Heidke score = Example: Suppose for OND 1997, rainfall forecasts are made for 15 stations in southern Brazil. Suppose forecast is defined by tercile-based category having highest probability. Suppose for all 15 stations, “above” is forecast with highest probability, and that observations were above normal for 12 stations, and near normal for 3 stations. Then Heidke score is: 100 X (12 – 15/3) / (15 – 15/3) 100 X 7 / 10 = 70 Note that the probabilities given in the forecasts did not matter, only which category had highest probability. This is a big weakness.
Correlation: Measuring the strength of Linear relationship between two variables --For diagnosis and understanding --For predictions of something in future (e.g. climate from SST patterns, or health situations from current rainfall observations)
Correlation between two variables Pearson product-moment correlation Correlation is a systematic relationship between x and y: When one goes up, the other tends to go up also, or may tend to go down. Need corresponding pairs of cases of x, y. “Perfect” positive correlation is +1 “Perfect” negative correlation is –1 No correlation (x and y completely unrelated) is 0 Correlation can be anywhere between –1 and +1. A relationship between x and y may or may not be causal – if not, x and y may be under control of some third variable. Correlation can be estimated visually by looking at a scatterplot of dots on an x vs. y graph.
Covariance and correlation between two variables x itself x itself x vs. y Standard Deviation = zx zy vs The above formula defines the Pearson product-moment correlation
| | | o | | o o | | o o o | | o | | o o |Y| o o o o | | o | | o o | | o o | | o | | o | | o | |_______________________________________________| X correlation = 0.8
| o | | o | | o o o | | o o o o | | o o o | | o o |Y| o o o o | | o o o | | o o o | | o o | | o | | o o o | | o | |_______________________________________________| X correlation = 0.55
| o | | |Y | | | | | | | | | o | |o o o | |oooooo o o | |oooooo_o_________________________________| X correlation = 0.87 (due to one outlier in upper right) If domination by one case is not desired, can use the Spearman rank correlation (correlation among ranks instead of actual values).
| o x | | o x | Y | o x | | x o | | x o | | o x | | x o | | x ocor = 0 | | x o cor = 1 | |_______________________________________| X correlation for all 18 points = 0.707 correlation squared = 0.5 When points having a perfect correlation are mixed with an equal number of points having no correlation, and the two sets have same mean and variance for X and Y, correlation is 0.707. Correlation squared (amount of variance predicted, or accounted for) is 0.5.
| | | | Y | | | | | o | | o o | | o o | | o o | | o o | |______o_______________________o____| X correlation = 0 but there is a strong nonlinear relationship The Pearson correlation only detects linear relationships
The use of linear correlation for prediction: Simple Linear Regression (“simple” implies just one predictor; if more than one, called Multiple Linear Regression) Determination of a regression line to fit points on the x vs. y scatterplot, so that if given a value of x, a “best prediction” can be made for y.
Spearman rank correlation Rank correlation is the Pearson correlation between the ranks of X vs. the ranks of Y, treating ranks as numbers. Rank correlation measures the strength of monotonic relationship between two variables. Rank correlation defuses outliers by not honoring original intervals between adjacent ranks. Adjacent ranks simply differ by 1. Simpler formula for rank correlation for small samples: If difference in rank for a given case is D, Spearman cor = 1 - If ranks identical for all cases, all D are zero and cor = 1. An example of the use of this formula is given in next slide.
Spearman rank correlation Rank correlation is simply the correlation between the ranks of X vs. the ranks of Y, treating ranks as numbers. When there are outliers, or when the X and/or Y data are very much non-normal, the Spearman rank correlation should be computed in addition to the standard correlation. Example of conversion to ranks for X or for Y: Original numbers: 2 9 189 3 21 7 Corresponding ranks: 6 3 1 5 2 4 can also be 1 4 6 2 5 3 Note in above example that the difference between 189 and 21 is treated as the same as that between 9 and 7.
Root-mean-Square Skill Score: RMSSS for continuous deterministic forecasts RMSSS is defined as: where: RMSEf = root mean square error of forecasts, and RMSEs = root mean square error of standard used as no-skill baseline. Both persistence and climatology can be used as baseline. Persistence, for a given parameter, is the persisted anomaly from the forecast period immediately prior to the LRF period being verified. For example, for seasonal forecasts, persistence is the seasonal anomaly from the season period prior to the season being verified. Climatology is equivalent to persisting an anomaly of zero. RMSf =
RMSf = where: i stands for a particular location (grid point or station). fi = forecasted anomaly at location i Oi = observed or analyzed anomaly at location i. Wi = weight at grid point i, when verification is done on a grid, set by Wi = cos(latitude) N = total number of grid points or stations where verification is carried. RMSSS is given as a percentage, while RMS scores for f and for s are given in the same units as the verified parameter.
The RMS and the RMSSS are made larger by three main factors: (1) The mean bias (2) The conditional bias (3) The correlation between forecast and obs It is easy to correct for (1) using a hindcast history. This will improve the score. In some cases (2) can also be removed, or at least decreased, and this will improve the RMS and the RMSSS farther. Improving (1) and (2) does not improve (3). It is most difficult to increase (3). If the tool is a dynamical model, a spatial MOS correction can increase (3), and help improve RMS and RMSSS. Murphy (1988), Mon. Wea. Rev.
Verification of Probabilistic Categorical Forecasts: The Ranked Probability Skill Score (RPSS) Epstein (1969), J. Appl. Meteor. RPSS measures cumulative squared error between categorical forecast probabilities and the observed categorical probabilities relative to a reference (or standard baseline) forecast. The observed categorical probabilities are 100% in the observed category, and 0% in all other categories. Where Ncat = 3 for tercile forecasts. The “cum” implies that the sum- mation is done for cat 1, then cat 1 and 2, then cat 1 and 2 and 3.
The higher the RPS, the poorer the forecast. RPS=0 means that the probability was 100% given to the category that was observed. The RPSS is the RPS for the forecast compared to the RPS for a reference forecast such as one that gives climatological probabilities. RPSS > 0 when RPS for actual forecast is smaller than RPS for the reference forecast.
Suppose that the forecast probabilities for terciles for 15 stations in JFM • 1998 in Colombia, and the observations were: • forecast(%)obs(%) RPS calculation • 1 20 30 50 0 0 100 RPS=(0-.20)2+(0-.50)2+(1.-1.)2 =.04+.25 +.0 = .29 • 2 25 35 40 0 0 100 RPS=(0-.25)2+(0-.60)2+(1.-1.)2 =.06+.36 +.0 = .42 • 3 25 35 40 0 0 100 • 4 20 35 45 0 0 100 RPS=(0-.20)2+(0-.55)2+(1.-1.)2 =.04+.30 +.0 = .34 • 5 15 30 55 0 0 100 • 6 25 35 40 0 0 100 • 7 25 35 40 0 100 0 RPS=(0-.25)2+(1-.60)2+(1.-1.)2 =.06+.16 +.0 = .22 • 8 25 35 40 0 0 100 • 9 20 35 45 0 0 100 • 10 25 35 40 0 0 100 • 11 25 35 40 0 100 0 • 12 20 35 40 0 100 0 • 13 15 30 55 0 0 100 RPS=(0-.15)2+(0-.45)2+(1.-1.)2 =.02+.20 +.0 = .22 • 14 25 35 40 0 0 100 • 25 35 40 0 0 100 • Finding RPS for reference (climatol baseline) forecasts: • for 1st forecast, RPS(clim) = (0-.33)2+(0-.67)2+(1.-1.)2 = .111+.444+0=.556 • for 7th forecast, RPS(clim) = (0-.33)2+(1.-.67)2+(1.-1.)2 = .111+.111+0=.222 • for a forecast whose observation is “below” or “above”, PRS(clim)=.556
forecast(%)obs(%) RPS and RPSS(clim) RPSS • 1 20 30 50 0 0 100 RPS= .29 RPS(clim)= .556 1-(.29/.556) = .48 • 2 25 35 40 0 0 100 RPS= .42 RPS(clim)= .556 1-(.42/.556) = .24 • 3 25 35 40 0 0 100 RPS= .42 RPS(clim)= .556 1-(.42/.556) = .24 • 4 20 35 45 0 0 100 RPS= .34 RPS(clim)= .556 1-(.34/.556) = .39 • 5 15 30 55 0 0 100 RPS= .22RPS(clim)= .556 1-(.22/.556) = .60 • 6 25 35 40 0 0 100 RPS= .42RPS(clim)= .556 1-(.42/.556) = .24 • 7 25 35 40 0 100 0 RPS= .22 RPS(clim)= .222 1-(.22/.222) = .01 • 8 25 35 40 0 0 100 RPS= .42 RPS(clim)= .556 1-(.42/.556) = .24 • 9 20 35 45 0 0 100 RPS= .34RPS(clim)= .556 1-(.34/.556) = .39 • 10 25 35 40 0 0 100 RPS= .42 RPS(clim)= .556 1-(.42/.556) = .24 • 11 25 35 40 0 100 0 RPS= .22 RPS(clim)= .222 1-(.22/.222) = .01 • 12 20 35 40 0 100 0 RPS= .22 RPS(clim)= .222 1-(.22/.222) = .01 • 13 15 30 55 0 0 100 RPS= .22 RPS(clim)= .556 1-(.22/.556) = .60 • 14 25 35 40 0 0 100 RPS= .42 RPS(clim)= .556 1-(.42/.556) = .24 • 25 35 40 0 0 100 RPS= .42 RPS(clim)= .556 1-(.42/.556) = .24 • Finding RPS for reference (climatol baseline) forecasts: • When obs=“below”, RPS(clim) = (0-.33)2+(0-.67)2+(1.-1.)2 =.111+.444+0=.556 • When obs=“normal”, RPS(clim)=(0-.33)2+(1.-.67)2+(1.-1.)2 =.111+.111+0=.222 • When obs=“above”, RPS(clim)= (0-.33)2+(0-.67)2+(1.-1.)2 =.111+.444+0=.556
RPSS for various tercile probability forecasts, when observation is “above”. forecast tercile Probabilities - 0 + RPSS 100 0 0 -2.60 90 10 0 -2.26 80 15 5 -1.78 70 25 5 -1.51 60 30 10 -1.11 50 30 20 -0.60 40 35 25 -0.30 33 33 33 0.00 25 35 40 0.24 20 30 50 0.48 10 30 60 0.69 5 25 70 0.83 Note: issuing too-confident forecasts 5 15 80 0.92 causes high penalty when incorrect. Skills 0 10 90 0.98 come out best for “true” probs. “True” 0 0 100 1.00 forecast probs have goodreliability.
The likelihood score The likelihood score is the nth root of the product of the probabilities given for the event that was later observed. for example, using terciles, suppose 5 forecasts were given as follows, and the category in red was observed: 45 35 20 The likelihood score 33 33 33 disregards what prob- 40 33 27 abilities were forecast 15 30 55 for categories that did 20 40 40 not occur. The likelihood score for this example (n=5) would be = = 0.40 This score could then be scaled such that 0.333 would be 0%, and 1 would be 100%. A score of 0.40 would translate to (0.40 - 0.333) / (1.00 - 0.333) = 10.0%.
Relative Operating Characteristics (ROC) for Probabilistic Forecasts Mason, I. (1982) Australian Met. Magazine The contingency table that ROC verification is based on: | Observation Observation | Yes No --------------------------------------------------------------------------- Forecast: Yes |O1 (hit) NO1 (false alarm) Forecast: NO | O2 (miss) NO2 (correct rejection) --------------------------------------------------------------------------- Hit Rate = 01 / (O1+O2) False Alarm Rate = NO1 / (NO1+NO2) The hit rate and false alarm rate are determined for descending categories of forecast probability. For high forecast probabilities, we hope hit rate rate will be high and false alarm rate low; and for low forecast probabilities, we hope hit rate will be low and false alarm rate will be high. For in-between probabilities, we expect some of each.
The curves are cumulative from left to right. For example, “20%” really means “100% + 90% +80% + ….. +20%”. Curves farther to the upper left show greater skill. no skill negative skill Example from Mason and Graham (2002), QJRMS, for eastern Africa OND simulations (observed SST forcing) using ECHAM3 AGCM
Results of Bayesian multi-model ensemble are evidenced in an analysis of reliability (the correspondence between forecast probability and relative observed frequency of occurrence). Simple pooling (assignment of equal weights to all AGCMs) gives more reliability than that of individual AGCMs, but the Bayesian method produces even more reliability. Note that flattish lines show model overconfidence, and 45º line shows perfect reliability. Above-Normal Below-Normal perfect reliability perfect reliability Bayesian Pooled Individual AGCM Observed relative Freq. Observed relative Freq. Forecast probability Forecast probability (3-model) JAS Precipitation, 30S-30N RELIABILITY ANALYSIS from Goddard et al. 2003 EGS-AGU-EGU Joint Assembly, Nice, France, April
RELIABILITY DIAGRAM Perfect reliability
Use of Multiple verification scores is encouraged. Different skill scores emphasize different aspects of skill. It is usually a good idea to use more than one score, and determine more than one aspect of skill. A reliability plot is also informative. Hit scores (such as Heidke) are increasingly being recognized as poor measures of probabilistic skill, since the probabilities are ignored (except for identifying which category has highest proba- bility). ROC, likelihood and RPSS are encouraged.
Tercile probabilities for various correlation skills and predictor signal strengths (in SDs). Assumes Gaussian probability distri- bution. Forecast (F) signal = (Predictor Signal) x (Correl Skill). *0.3 **0.04