Download

1 / 19
190 likes | 231 Views
Learn about Bayes' Theorem and how expected values are calculated in probability theory. Explore examples and mathematical concepts to deepen your understanding of these principles.

E N D
Bayes’ Theorem and Expected Values
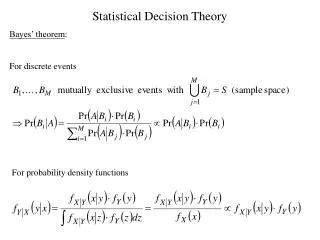
Bayes’ Theorem is the actually the same rule we’ve been using to do conditional probability. Let’s take a look: • Ex. 1 Coffee making machines, Alpha and Beta, produce 65% and 35% • of coffee sold each day in identically shaped plastic cups. Alpha underfills • a cup 4% of the time and machine Beta underfills 5% of the time. • If a cup of coffee is chosen at random, what is the probability it is • underfilled? • b)A cup of coffee is randomly chosen and is found to be underfilled. • What is the probability that it came from Alpha? DRAW A TREE DIAGRAM! .04 U a) P(U) = P(A and U) + P(B and U) Alpha .65 .96 U’ = (.65)(.04) + (.35)(.05) = .0435 .05 U .35 Beta b) .95 U’ = .598
A random variable represents in number form the possible outcomes that may occur for some random experiment. A discrete random variableX has only positive whole number values. ie.- the number of trout in a lake - the number of defective light bulbs in an order at Home Depot A continuous random variableX has all possible values in some interval (say on a number line) ie.- the heights of men could all lie in the interval -the volume of water in a rainwater tank during a given month Generally speaking a discrete random variable involves a count whereas a continuous random variable involves measurements. For any random variable, there is a probability distribution for it. is the probability of x occuring
Ex. 2 A supermarket has three checkout points A, B, and C. Consumer • affairs checks for accuracy of weight scales at each checkout. If a scale • is accurate yes (Y) is recorded, if not, no (N). Suppose the random • variable is: X is the number of accurate scales at the supermarket. • List the possible outcomes b) Describe using x the events of • there being: i) one accurate scale ii) at least one accurate scale Let’s set up a chart for the possible outcomes: A B C x i) one accurate scale corresponds to x = 1 N N N 0 Y N N 1 N Y N 1 ii) at least one accurate scale corresponds to x =1, 2 or 3 N N Y 1 N Y Y 2 Y N Y 2 Y Y N 2 Y Y Y 3
The probability distribution of a discrete random variable can be given in table form, graphical form, or functional form. • Ex. 3 A magazine store recorded the number of magazines purchased by • its customers in one day. 23% purchased one magazine, 38% purchased • two, 21% purchased three, 13% purchased four, and 5% purchased 5. • What is the random variable? b) Make a random variable table. • c) Graph the probability distribution using a spike graph. • The random variable X is the number of magazines sold. • x = 0,1,2,3,4,5 b) Notice that all the probabilities add up to 1! c) This is necessary to have a probability distribution!
Ex. 4 Show that the following are probability distribution functions: a) b) In order to be a probability distribution to things must happen: 1) 2) a) All of these values lie between 0 and 1. Also:
b) Again, notice that and
Ex. 5 A bag contains 5 blue and 3 green tickets. Two tickets are randomly selected (without replacement). X denotes the number of blue tickets selected. Find the probability distribution of X. 2nd Event x Probability 1st 4/7 B (5/8)(4/7)=20/56 BB 2 B 5/8 BG 1 (5/8)(3/7)=15/56 3/7 G 5/7 B (3/8)(5/7)=15/56 GB 1 3/8 G 0 (3/8)(2/7)=6/56 2/7 G GG 1
Suppose you are going to roll a die 120 times. On how many occasions would you expect the result to be a 6? The possible outcomes of each roll are 1, 2, 3, 4, 5, 6 and each is equally likely to occur. We would expect 1/6 of the rolls to land on a 6. Therefore we “expect” (1/6)120 or 20 rolls to land on a 6. This is the expectation: If there are n members of a sample and the probability of an event occurring is p for each member, then the expectation of the occurrence of that event is given by:
Ex. 6 In a casino game a die is rolled and the returns to the player are given according to the “pay table.” To play the game $4 is needed. A result of rolling a 6 wins $10, so in fact you are ahead by $6 if you get a 6 on the first roll. What are your chances of playing one game and winning: a) $10 b) $4 c) $1 P(win $10) = P(6) = 1/6 P(win $4) = P(4 or 5) = 2/6 P(win $1) = P(1,2, or 3) = 3/6 You “expected return” from rolling a 6 is: What is your expected return from throwing a 4 or 5? What is your expected return from throwing a 1,2, or 3?
So your expected return from throwing a 1,2,3,4,5,6: =$3.50 So for playing one game, our “expected return” at the end of the game is E(X) = $3.50 Since it cost $4 to play, this means we will lose $0.50 in playing one game. What is the expected result at the end of 100 games? Since we are losing $0.50 per game, over 100 trials the expected loss: This is how casinos make their money!!
We can summarize this by saying the expectation E(x) of a random variable: where are the particular outcomes and is the probability of occurring
Ex. 7 A person plays a game with coins. If a double head is spun, $10 • is won. If a head and a tail appear, $3 is won. If a double tail appears • $5 is lost. • How much would a person expect to win playing this game once? • If the organizer of the game is allowed to make an average of $1 per • game, how much should be charged to play the game once? a) Expectation b) We should charge at least $3.75 per game.
Ex. 8 The CNA Insurance Company charges Mike $250 for a one-year $100,000 life insurance policy. Because Mike is a 21-year old male, there is a 0.9985 probability that he will live for a year. What would be insurance company’s investment in Mike? This is how the insurance company makes a profit. The risk of his death is so low, that they are only putting out an expected value of $150. But he paid $250 for the policy.
Let’s expand this a bit from the insurance company’s perspective: The company sells a policy to Mike that pays $100,000 is he dies within the next 5 years. Keep in mind they are collecting a premium from him of $250 per year. The amount X that the company earns on the policy is $250 per year, less the $100,000 they must pay if he dies. Fill in the missing value in the probability distribution table and calculate the company’s expected profit, E(X). (Remember the probabilities must add up to 1.)
Ex. 9 A country exports crayfish to overseas markets. The buyers pay a high price when the crayfish arrive still alive. If X is the number of deaths per dozen crayfish, the probability distribution for X is given by: a) Find k. 0.54 + 0.26 + 0.15 + k + 0.01 + 0.01 + 0 = 1 k = 0.03 b) Over a long period, what is the mean number of deaths per dozen crayfish? c) Find , the standard deviation for the probability distribution.
Properties of E(X) if k is a constant for functions A and B Property of Var(X) (This just gives us another way to calculate variance.)
Ex. 10X has a probability distribution: a) Find the mean of X b) the variance of X c) the standard deviation of X For the variance: Using the new formula: