Download

1 / 30
300 likes | 330 Views
This project tracks grain purity using dynamic modelling to prevent GM contamination in local elevators. Explore differential equations for grain mixing processes to ensure purity.

E N D
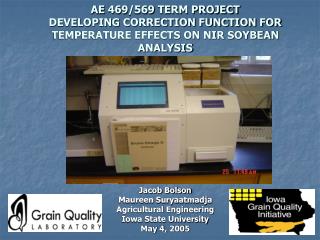
AE 503 TERM PROJECTTRACKING THE PURITY OF NON-GM GRAIN AT THE LOCAL ELEVATOR USING DYNAMIC MODELLING Maureen Suryaatmadja Graduate Research Assistant Agricultural Engineering Iowa State University April 29, 2005
Introduction • Traceability is the ability to trace the history, application or location of an entity by means of recorded identifications (Hurburgh, 2004) • Traceability has become a major concern for food manufacturers and commodity handlers
Introduction • The issue of GMO has been closely associated with traceability. In reality, product tracking serves much wider such as: • To document a chain of custody of a product. • To document how a product was produced or handled. • To meet consumer desire for connection with the earth and production and the environment and/or some other socio-religious need. • To provide due diligence for buyer safety/quality assurance • To respond to the security needs or regulations. (Hurburgh, 2004)
Problem Statement • The bulk grain production and marketing system has not been considered adaptable to identity tracking, but there have been programs to produce special grains for individual users that require some form of purity maintenance. • More recently, EU customers had begun asking for assurances that certain GM materials were kept out of commodity grain, to an 0.9% or less mixing level.
Flow Chart • Grain Flow Chart Local Elevator Flow Chart
Problem Statement • The key areas in an elevator that provide challenges for Identity Preservation (IP): • Receiving pits • Conveyors • Legs • Storage Bins (Thelen, 1999) • This project will analyze the mixing process in the pit and conveyor, and bucket elevator (legs)
Objective • To build a dynamic simulation model that tracks the grain purity at the local elevator with the respect to the purity of non-GM grain from GM grain contamination.
Assumptions • The grain is checked for the initial purity before it unloads from the truck (GM/non-GM grain). • The system only use one pit. • There will be no cleaning activity in the pit, conveyor and bucket elevator. • There will be some grain left in the pit and the bucket. • The process is perfect mixing.
Assumptions • The final purity is the grain purity after exiting the bucket. • After exiting the bucket elevator, the non-GM grain will be stored at non GM bin and the GM grain will be stored at GM bin.
Differential Equations Development • Mass balance equation: dM/dt = qin – qout (1) M = accumulated mass of the grain (kg) dM/dt = mass flow rate of the grain (kg/s) qin = grain flow rate entering the tank (kg/s) qout = grain flow rate exiting the tank (kg/s)
Differential Equations Development • Mass balance of the contaminant: dmc/dt = qin Cin – qout Cout (2) Cout = mc/M (dimensionless) (3) Equation (3) is divided by M become: dCout/dt = 1/M (qin Cin – qout Cout) (4) mc = mass of the contaminant grain (kg) dmc/dt = mass flow rate of the contaminant grain (kg/s) qin = grain flow rate entering the tank (kg/s) qout = grain flow rate exiting the tank (kg/s) C in = grain concentration entering the tank (%) C out = grain concentration exiting the tank (%)
Differential equation application of grain mixing process in the local elevator • At the pit and conveyor dMpit/dt = qpiti - qpite (5) dCconve /dt = 1/(dMpit/dt) (qconvi Cconvi - qconve Cconve) (6) dMpit/dt = the grain mass rate of change of left in the pit dCconve/dt = the grain purity rate of change exiting the conveyor qpiti = grain flow rate entering the pit qpite = grain flow rate exiting the pit Cconvi = the purity of grain entering the pit and conveyor (initial purity of grain) Cconve = the purity of grain exiting the conveyor q truck out = q pit in q pit out = q conveyor in = q conveyor out
Differential equation application of grain mixing process in the local elevator • At the bucket elevator dMbucket/dt = qbucketi - qbuckete (7) dCbuckete/dt = 1/(dMbucket/dt) (qbucketi Cbucketi - qe Cbuckete) (8) dM/dt = the grain mass rate of change in the bucket dCbuckete /dt = the grain purity rate of change exiting the bucket qbucketi = grain flow rate entering the bucket elevator qbuckete = grain flow rate exiting the bucket elevator Cbucketi = the purity of grain entering the bucket elevator Cbuckete = the purity of grain exiting the bucket elevator (final purity of grain) q conveyor out = q bucket in Cbucketin = Cconve
Simulink Model • The simulink model consist of four subsystems: • The first subsystem describes the changing of the grain mass in the pit dMpit/dt = qpiti - qpite , qpit e = A (Mpit –C) 2. The second subsystem describes the changing of the grain purity after exiting the conveyor dCconve /dt = 1/(dMpit/dt) (qconvi Cconvi - qconve Cconve) 3. The third subsystem describes the changing of the grain mass in the bucket dMbucket/dt = qbucketi – qbuckete • The fourth subsystem describes the changing of the grain purity after exiting the bucket elevator dCbuckete/dt = 1/(dMbucket/dt) (qbucketi Cbucketi - qe Cbuckete)
MATLAB INPUT close all % Close all open figures clear all % Clears all the variables in the workspace Con = [0 100 0 100 ]; simsave = []; for load = 1:4 disp(load); currentloadpurity = Con(load); if load == 1 mpit = 0.0001; cpit = 0; mbucket = 0.0001; cbucket = 0; else mpit = simout.signals.values(size(simout.signals.values,1),1); cpit = simout.signals.values(size(simout.signals.values,1),2); mbucket = simout.signals.values(size(simout.signals.values,1),3); cbucket = simout.signals.values(size(simout.signals.values,1),4); end [T,X,Y]= sim('impurity',[0 8000]); disp(simout.signals.values(size(simout.signals.values,1),1:4)); simsave = [simsave; simout.signals.values]; end
Input Value • First Step step time = 12.5 initial value = 0 final value = 17.5 sample time = 0 • Second Step step time = 367.5 initial value = 0 final value = -17.5 sample time = 0
Input Value • Mpit initial before the first load flow = 0.0001 kg • Cpit initial before the first load flow = 0 • Mbucket initial before the first load flow = 0.0001 kg • Cbucket initial before the first load flow = 0 • Switch function in the pit: qpite = A(Mpit – C) A = 0.001 C = 0.5 Treshold = 7, 15 • Switch function in the bucket elevator: qbuckete = A(Mbucket – C) A = 1.5 C = 7, 15 Treshold =7,15 T = 8000 s
Result • First Combination Load: • GM load = 0% non-GM load • Non-GM load = 100% non-GM load • GM load = 0% non-GM load • Non-GM load = 100% non-GM load
Result • The second combination load: • GM load = 0% non-GM load • GM load = 0% non-GM load • Non-GM load = 100% non-GM load
Conclusion • The model is not able to describe all the processes that happen in the local elevator; however it can be used to track the purity of the grain. • The final purity level depends on the amount of grain that left in the pit and the bucket. • When the amount of grain left in the pit and the bucket increase, the final purity level will decrease. • It is important to keep grain left in the pit and bucket as least as possible. • The future development should improve the accuracy of the model and describe all the processes happen in the local elevator.
SPECIAL THANKS TO:DR. BRIAN STEWARD for his valuable advises and helps in developing the simulation model