Download
1 / 65
650 likes | 667 Views
Learn how chromosomes and genes are interconnected, their behavior during meiosis, and the implications on genetic inheritance based on Mendel's laws. Explore Mendelian inheritance, Morgan’s fruit fly experiments, sex-linked genes, and X-linked traits in this chapter summary.

E N D
Aim: How can we describe the “Chromosome Theory of inheritance”? Do Now: Look at the photograph projected. Describe what you see in as much detail as possible. Homework: Complete chapter 12 concept questions.
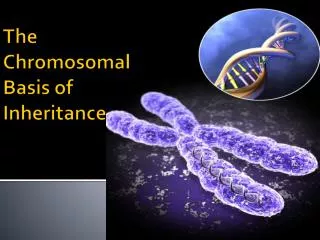
Overview: Locating Genes Along Chromosomes Mendel’s “hereditary factors” were genes Today we know that genes are located on chromosomes The location of a particular gene can be seen by tagging isolated chromosomes with a fluorescent dye that highlights the gene
Concept 12.1: Mendelian inheritance has its physical basis in the behavior of chromosomes Mitosis and meiosis were first described in the late 1800s The chromosome theory of inheritance states: Mendelian genes have specific loci (positions) on chromosomes Chromosomes undergo segregation and independent assortment The behavior of chromosomes during meiosis can account for Mendel’s laws of segregation and independent assortment
Figure 12.2 / / / / 1 1 1 1 4 4 4 4 P Generation Yellow-round seeds (YYRR) Green-wrinkled seeds (yyrr) y Y r R r R Y y Meiosis Fertilization r y R Y Gametes All F1 plants produce yellow-round seeds (YyRr). F1 Generation R R y y r r Y Y Meiosis LAW OF SEGREGATION The two alleles for each gene separate. LAW OF INDEPENDENT ASSORTMENT Alleles of genes on nonhomologous chromosomes assort independently. r r R R Metaphase I y Y Y y 1 1 r r R R Anaphase I Y Y y y Metaphase II r R R r 2 2 y Y y Y y Y Y y Y y y Y r R R r r r R R yr yR Yr YR YR F2 Generation An F1 F1 cross-fertilization 3 3 Fertilization results in the 9:3:3:1 phenotypic ratio in the F2 generation. Fertilization recombines the R and r alleles at random. 9 : 3 : 3 : 1
Figure 12.2c LAW OF SEGREGATION LAW OF INDEPENDENT ASSORTMENT F2 Generation 3 3 An F1 F1 cross-fertilization Fertilization results in the 9:3:3:1 phenotypic ratio in the F2 generation. Fertilization recombines the R and r alleles at random. 9 : 3 : 3 : 1
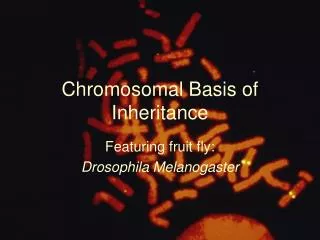
Morgan’s Experimental Evidence: Scientific Inquiry Thomas Hunt Morgan and his students began studying the genetics of the fruit fly, Drosophila melanogaster, in 1907 Several characteristics make fruit flies a convenient organism for genetic studies: They produce many offspring A generation can be bred every two weeks They have only four pairs of chromosomes
Morgan noted wild-type, or normal, phenotypes that were common in the fly populations Traits alternative to the wild type are called mutant phenotypes The first mutant phenotype they discovered was a fly with white eyes instead of the wild type, red
Correlating Behavior of a Gene’s Alleles with Behavior of a Chromosome Pair In one experiment, Morgan mated male flies with white eyes (mutant) with female flies with red eyes (wild type) The F1 generation all had red eyes The F2 generation showed the classical 3:1 red:white ratio, but only males had white eyes Morgan concluded that the eye color was related to the sex of the fly
Morgan determined that the white-eyed mutant allele must be located on the X chromosome Morgan’s finding supported the chromosome theory of inheritance
Figure 12.4 Experiment Conclusion P Generation w w P Generation X X X Y w F1 Generation All offspring had red eyes. w Sperm Eggs w w F1 Generation w Results w F2 Generation w Sperm Eggs w w w F2 Generation w w w w w
Concept 12.2: Sex-linked genes exhibit unique patterns of inheritance In humans and some other animals, there is a chromosomal basis of sex determination In humans and other mammals, there are two varieties of sex chromosomes: a larger X chromosome and a smaller Y chromosome Only the ends of the Y chromosome have regions that are homologous with corresponding regions of the X chromosome The SRY gene on the Y chromosome is required for the developments of testes
Figure 12.5 X Y
Females are XX, and males are XY Each ovum contains an X chromosome, while a sperm may contain either an X or a Y chromosome Other animals have different methods of sex determination
Figure 12.6 44 XY 44 XX Parents 22 X 22 Y 22 X or Sperm Egg 44 XX 44 XY or Zygotes (offspring)
A gene that is located on either sex chromosome is called a sex-linked gene Genes on the Y chromosome are called Y-linked genes; there are few of these Genes on the X chromosome are called X-linked genes
Aim: How can we describe sex-linked traits? Do Now: Describe a sex-linked trait? Do you know of any sex-linked traits?
Inheritance of X-Linked Genes X chromosomes have genes for many characters unrelated to sex, whereas the Y chromosome mainly encodes genes related to sex determination
X-linked genes follow specific patterns of inheritance For a recessive X-linked trait to be expressed: A female needs two copies of the allele (homozygous) A male needs only one copy of the allele (hemizygous) X-linked recessive disorders are much more common in males than in females
Figure 12.7 XnY XNXN Sperm Y Xn XNXn XNY Eggs XN XNXn XNY XN (a) XNXn XNY XnY XNXn Sperm Sperm XN Y Xn Y Eggs Eggs XNXN XNY XNXn XNY XN XN XNXn XnXn Xn Xn XnY XnY (b) (c)
Some disorders caused by recessive alleles on the X chromosome in humans: Color blindness (mostly X-linked): Inability to see certain colors. Duchenne muscular dystrophy: lack of muscle tone. Hemophilia: blood does not clot normally.
X Inactivation in Female Mammals In mammalian females, one of the two X chromosomes in each cell is randomly inactivated during embryonic development The inactive X condenses into a Barr body If a female is heterozygous for a particular gene located on the X chromosome, she will be a mosaic for that character
Figure 12.8 X chromosomes Allele for orange fur Early embryo: Allele for black fur Cell division and X chromosome inactivation Two cell populations in adult cat: Active X Inactive X Active X Black fur Orange fur
Each chromosome has hundreds or thousands of genes (except the Y chromosome) Genes located on the same chromosome that tend to be inherited together are called linked genes Concept 12.3: Linked genes tend to be inherited together because they are located near each other on the same chromosome
How Linkage Affects Inheritance Morgan did experiments with fruit flies that show how linkage affects inheritance of two characters Morgan crossed flies that differed in traits of body color and wing size Morgan found that body color and wing size are usually inherited together in specific combinations (parental phenotypes) He reasoned that since these genes did not assort independently, they were on the same chromosome
Figure 12.UN01 b vg b vg F1 dihybrid female and homozygous recessive male in testcross b vg b vg b vg b vg Most offspring or b vg b vg
Figure 12.9a Experiment P Generation (homozygous) Wild type (gray body, normal wings) Double mutant (black body, vestigial wings) bbvgvg b b vg vg F1 dihybrid testcross Homozygous recessive (black body, vestigial wings) Wild-type F1 dihybrid (gray body, normal wings) b bvg vg bbvgvg
Figure 12.9b Experiment Testcross offspring b vg bvg b vg bvg Eggs Gray- vestigial Wild-type (gray-normal) Black- vestigial Black- normal bvg Sperm bbvgvg b bvg vg bbvg vg b bvgvg PREDICTED RATIOS Genes on different chromosomes: : : : 1 1 1 1 Genes on same chromosome: : : : 1 1 0 0 Results 965 : : : 944 206 185
However, nonparental phenotypes were also produced Understanding this result involves exploring genetic recombination, the production of offspring with combinations of traits differing from either parent The genetic findings of Mendel and Morgan relate to the chromosomal basis of recombination
Recombination of Unlinked Genes: Independent Assortment of Chromosomes Mendel observed that combinations of traits in some offspring differ from either parent Offspring with a phenotype matching one of the parental phenotypes are called parental types Offspring with nonparental phenotypes (new combinations of traits) are called recombinant types, or recombinants A 50% frequency of recombination is observed for any two genes on different chromosomes
Figure 12.UN02 Gametes from yellow-round dihybrid parent (YyRr) yr YR Yr yR Gametes from green- wrinkled homozygous recessive parent (yyrr) yr YyRr yyrr Yyrr yyRr Recombinant offspring Parental- type offspring
Aim: How can we describe the recombination of linked genes? Do Now: Describe a chromosomal alteration. In your opinion are they good or bad? Why?
Recombination of Linked Genes: Crossing Over Morgan discovered that even when two genes were on the same chromosome, some recombinant phenotypes were observed He proposed that some process must occasionally break the physical connection between genes on the same chromosome That mechanism was the crossing over between homologous chromosomes Animation: Crossing Over
Figure 12.10a P generation (homozygous) Wild type (gray body, normal wings) Double mutant (black body, vestigial wings) b vg+ bvg b vg+ bvg Wild-type F1 dihybrid (gray body, normal wings) b vg+ bvg
Figure 12.10b F1 dihybrid testcross bvg b vg+ Homozygous recessive (black body, vestigial wings) Wild-type F1 dihybrid (gray body, normal wings) bvg bvg b vg+ bvg b vg+ bvg bvg bvg bvg bvg Meiosis I b vg+ Meiosis I and II b vg bvg Recombinant chromosomes bvg Meiosis II b+ vg+ b+ vg bvg bvg+ bvg Eggs Sperm
Figure 12.10c Recombinant chromosomes b vg+ b vg bvg bvg Eggs 965 Wild type (gray-normal) 944 Black- vestigial 206 Gray- vestigial 185 Black- normal Testcross offspring bvg b vg bvg b vg bvg bvg bvg bvg bvg Sperm Recombinant offspring Parental-type offspring Recombination frequency 391 recombinants 100 17% 2,300 total offspring
New Combinations of Alleles: Variation for Normal Selection Recombinant chromosomes bring alleles together in new combinations in gametes Random fertilization increases even further the number of variant combinations that can be produced This abundance of genetic variation is the raw material upon which natural selection works
Mapping the Distance Between Genes Using Recombination Data: Scientific Inquiry Alfred Sturtevant, one of Morgan’s students, constructed a genetic map, an ordered list of the genetic loci along a particular chromosome Sturtevant predicted that the farther apart two genes are, the higher the probability that a crossover will occur between them and therefore the higher the recombination frequency
A linkage map is a genetic map of a chromosome based on recombination frequencies Distances between genes can be expressed as map units; one map unit represents a 1% recombination frequency
Figure 12.11 Results Recombination frequencies 9% 9.5% Chromosome 17% b cn vg
Genes that are far apart on the same chromosome can have a recombination frequency near 50% Such genes are physically linked, but genetically unlinked, and behave as if found on different chromosomes
Sturtevant used recombination frequencies to make linkage maps of fruit fly genes Using methods like chromosomal banding, geneticists can develop cytogenetic maps of chromosomes Cytogenetic maps indicate the positions of genes with respect to chromosomal features
Figure 12.12 Mutant phenotypes Black body Brown eyes Short aristae Cinnabar eyes Vestigial wings 0 48.5 57.5 67.0 104.5 Gray body Long aristae (appendages on head) Red eyes Normal wings Red eyes Wild-type phenotypes
Concept 12.4: Alterations of chromosome number or structure cause some genetic disorders Large-scale chromosomal alterations in humans and other mammals often lead to spontaneous abortions (miscarriages) or cause a variety of developmental disorders Plants tolerate such genetic changes better than animals do
Abnormal Chromosome Number In nondisjunction, pairs of homologous chromosomes do not separate normally during meiosis As a result, one gamete receives two of the same type of chromosome, and another gamete receives no copy Video: Nondisjunction
Figure 12.13-1 Meiosis I Nondisjunction
Figure 12.13-2 Meiosis I Nondisjunction Meiosis II Non- disjunction
Figure 12.13-3 Meiosis I Nondisjunction Meiosis II Non- disjunction Gametes n n n 1 n 1 n− 1 n− 1 n 1 n− 1 Number of chromosomes (a) (b) Nondisjunction of homo- logous chromosomes in meiosis I Nondisjunction of sister chromatids in meiosis II