Download
1 / 14
140 likes | 174 Views
Explore PML curve solutions for strategic reinsurance decisions to manage catastrophe risk effectively. Learn how to split the curve into distinct regions for better risk assessment. Final exhibit for impactful board decisions.

E N D
Optimizing your Catastrophe Reinsurance Program:Making Recommendations to the Board Casualty Actuarial Society Loss Reserving Seminar Washington, D.C. September 18-19, 2008 Glenn Hiltpold, F.C.A.S.
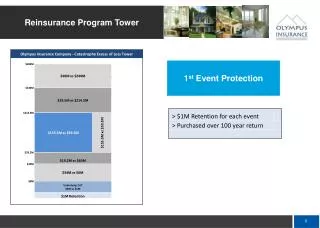
Probability on Non- Return Gross Exceedance Time PML 90.00% 10 $1,124.4 95.00% 20 $11,586.4 96.00% 25 $20,157.6 98.00% 50 $60,110.5 99.00% 100 $99,618.5 99.50% 200 $169,671.2 99.75% 400 $267,216.2 The PML Curve
The 100 Year Storm “So, is this going to happen once every 100 years?”
The PML Curve Solution 1 – Use Logic to more accurately describe the curve… “Probable Maximum Loss = Improbable Minimum Loss”
The PML Curve Solution 2 – Visual Depiction of how Cat Reinsurance transforms the curve Three Choices: 1. Upper Limit 2. Company Retention (“Lower Limit”) 3. Company Participation
The PML Curve We still have the same problem. The graphs are interesting, and are a good aid in understanding what reinsurance will do to your catastrophe risk, but how do you go from the picture to a proposed reinsurance structure? (Especially considering the fourth graph.)
The PML Curve Solution 3 – - Do Not focus on specific PML points. - Instead, split the curve into company specific “Regions” 1. No Hurricane 2. “Annoyance” 3. “Irritation” 4. “Impairment” 5. “Devastation”
Regions Further Defined 1. No Hurricane – From the PML Curve, what is the probability that there is NO event in a given year? 2. “Annoyance” – Probability of events with Loss from >$0 to <5% of Surplus. • “Irritation” – Probability of events from >5% of Surplus up to Expected Net Income. • “Impairment” – Probability of events >Net Income, but less than Surplus. 5. “Devastation” – Probability of events > Surplus.