Download
1 / 30
310 likes | 375 Views
This article provides an overview of DEB theory, focusing on the criteria for developing general energy models in biology. The theory is quantitative and based on explicit assumptions to ensure mass and energy balancing. Criteria such as consistency, simplicity, generality, and explanatory power are essential. Various empirical patterns related to feeding, growth, reproduction, respiration, stoichiometry, and energy dissipation are discussed and linked to DEB theory. The concept of homeostasis and the standard DEB model with its processes and extensions are also explored. Topological alternatives and case studies showcasing growth at constant food are presented, along with insights on phototrophic organisms. DEB theory is well-tested against empirical data, making it a robust framework in theoretical biology.

E N D
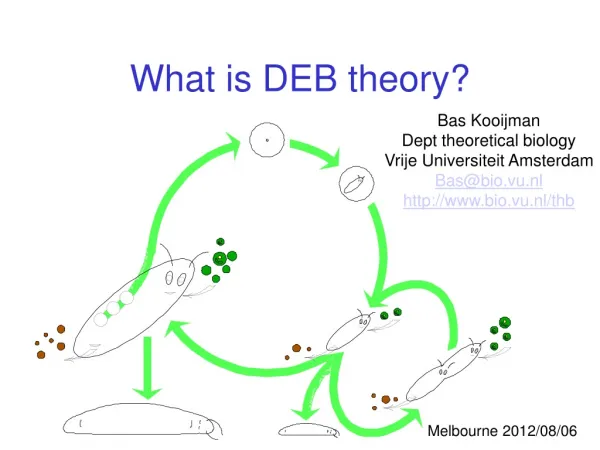
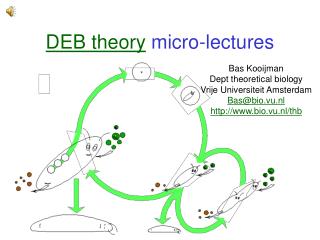
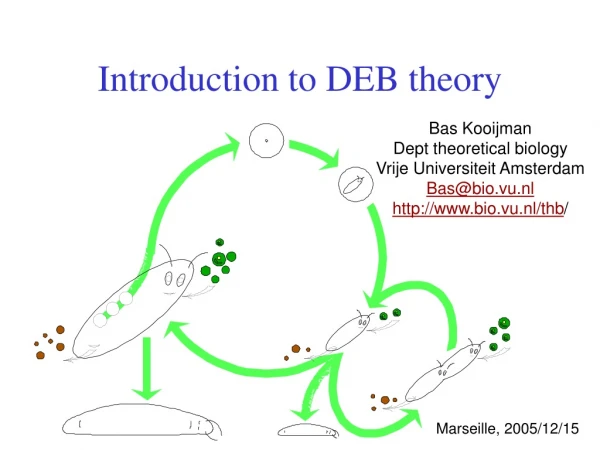
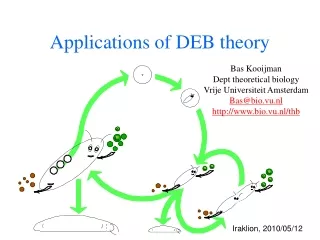
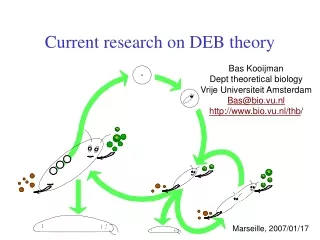
DEB theory, an introduction Bas Kooijman Dept theoretical biology Vrije Universiteit Amsterdam Bas@bio.vu.nl http://www.bio.vu.nl/thb/ Groningen, 2011/09/29
Criteria for general energy models • Quantitative Based on explicit assumptions that together specify all quantitative aspects to allow for mass and energy balancing • Consistency Assumptions should be consistent in terms of internal logic, with physics and chemistry, as well as with empirical patterns • Simplicity Implied model(s) should be simple (numbers of variables and parameters) enough to allow testing against data • Generality The conditions species should fulfill to be captured by the model(s) must be explicit and make evolutionary sense • Explanatory The more empirical patterns are explained, the better the model From Sousa et al 2010 Phil. Trans. R. Soc. Lond. B365: 3413-3428
Empirical patterns Feeding During starvation, organisms are able to reproduce, grow and survive for some time At abundant food, the feeding rate is at some maximum, independent of food density Growth Many species continue to grow after reproduction has started Growth of isomorphic organisms at abundant food is well described by the von Bertalanffy For different constant food levels the inverse von Bertalanffy growth rate increases linearly with ultimate length The von Bertalanffy growth rate of different species decreases almost linearly with the maximum body length Fetuses increase in weight approximately proportional to cubed time Reproduction Reproduction increases with size intra-specically, but decreases with size inter-specifically Respiration Animal eggs and plant seeds initially hardly use dioxygen The use of dioxygen increases with decreasing mass in embryos and increases with mass in juveniles and adults The use of dioxygen scales approximately with body weight raised to a power close to 0.75 Animals show a transient increase in metabolic rate after ingesting food (heat increment of feeding) Stoichiometry The chemical composition of organisms depends on the nutritional status (starved vs well-fed) The chemical composition of organisms growing at constant food density becomes constant Energy Dissipating heat is a weighted sum of 3 mass flows: carbon dioxide, dioxygen and nitrogenous waste From Sousa et al 2008 Phil. Trans. R. Soc. Lond. B363: 2453-2463
DEB theory is axiomatic, based on mechanisms not meant to glue empirical models Since many empirical models turn out to be special cases of DEB theory the data behind these models support DEB theory This makes DEB theory very well tested against data Empirical special cases of DEB 11.1
DEB papers prediction for 2012: 1 paper per week http://www.bio.vu.nl/thb/deb/
Homeostasis 1.2 strong homeostasis constant composition of pools (reserves/structures) generalized compounds, stoichiometric contraints on synthesis weak homeostasis constant composition of biomass during growth in constant environments determines reserve dynamics (in combination with strong homeostasis) structural homeostasis constant relative proportions during growth in constant environments isomorphy .work load allocation thermal homeostasis ectothermy homeothermy endothermy acquisition homeostasis supply demand systems development of sensors, behavioural adaptations
storage product formation maturation growth reproduction aging feeding digestion maintenance Standard DEB model 2a Isomorph with 1 reserve & 1 structure feeds on 1 type of food has 3 life stages (embryo, juvenile, adult) Processes: Balances: mass, energy , entropy, time • Extensions: • more types of food and food qualities • more types of reserve (autotrophs) • more types of structure (organs, plants) • changes in morphology • different number of life stages
defecation feeding food faeces assimilation reserve somatic maintenance maturity maintenance 1- maturation reproduction growth maturity offspring structure Standard DEB scheme 2b 1 food type, 1 reserve, 1 structure, isomorph time: searching & handling feeding surface area weak & strong homeostasis κ-rule for allocation to soma maintenance has priority somatic maint structure maturity maint maturity stage transition: maturation embryo: no feeding, reprod juvenile: no reproduction adult: no maturation maternal effect: reserve density at birth equals that of mother initially: zero structure, maturity
Topological alternatives 11.1c From Lika & Kooijman 2011 J. Sea Res, to appear
Growth at constant food 2.6.1 length, mm Von Bert growth rate -1, d time, d ultimate length, mm Von Bertalanffy growth curve:
Faculative phototrophy 10.2.3x Euglenophyta Ciliophora photo- & heterotrophs only differ in their assimilation module 2 individuals that follow the standard DEB model can merge such that the merged individual again follows the standard DEB model Euplotes muscicola Facus alatus, two individuals from the same small pool in Speudersbos Many phototrophs can be green or coulorless. Facus still has chloroplasts, but sometimes no chlorophyll.
Embryonic development 2.6.2d Crocodylus johnstoni, Data from Whitehead 1987 embryo yolk O2 consumption, ml/h weight, g time, d time, d
Stage transitions at maturity thresholds Danio rerio 28.5°C Augustine et al 2011 Comp. Biochem. Physiol. A 159 :275–283
Stage transitions at maturity thresholds < birth : isomorph birth-metamorphosis: V1-morph > metamorphosis : isomorph Danio rerio 28.5°C Data: Lauwrence et al 2008 caloric restiction Data: Augustine Augustine et al 2011 Comp. Biochem. Physiol. A 159 :275–283
Acceleration of development acceleration development no yes indirect Crinia georgiana Pseudophryne bibronii direct Crinia nimbus Geocrinia vitellina
1 ¾ ½ ¼ 0 1 ¾ ½ ¼ 0 Acceleration of development Mueller et al 2011, subm Crinia georgiana max dry weight 500 mg metam hatch birth metam birth Dry mass, mg hatch O2 nmol/h 12 °C age, d age, d Pseudophryne bibronii metam max dry weight 200 mg metam birth hatch Dry mass, mg hatch birth O2 nmol/h age, d age, d
Scaling of respiration 8.2.2d Respiration: contributions from growth and maintenance Weight: contributions from structure and reserve Kooijman 1986 J Theor Biol 121: 269-282
Metabolic rate 8.2.2e slope = 1 Log metabolic rate, w O2 consumption, l/h 2 curves fitted: endotherms 0.0226 L2 + 0.0185 L3 0.0516 L2.44 ectotherms slope = 2/3 unicellulars Log weight, g Length, cm Intra-species Inter-species (Daphnia pulex) Data: Richman 1958; curve fitted from DEB theory Data: Hemmingson 1969; curve fitted from DEB theory
Change in body shape 4.2.2 Isomorph: surface area volume2/3 volumetric length = volume1/3 Mucor Ceratium Merismopedia V0-morph: surface area volume0 V1-morph: surface area volume1
Isomorphic growth 2.6c diameter, m Weight1/3, g1/3 Amoeba proteus Prescott 1957 Saccharomyces carlsbergensis Berg & Ljunggren 1922 time, h time, h Weight1/3, g1/3 Toxostoma recurvirostre Ricklefs 1968 length, mm Pleurobrachia pileus Greve 1971 time, d time, d
Mixtures of V0 & V1 morphs 4.2.3a volume, m3 hyphal length, mm Bacillus = 0.2 Collins & Richmond 1962 Fusarium = 0 Trinci 1990 time, min time, h volume, m3 volume, m3 Escherichia = 0.28 Kubitschek 1990 Streptococcus = 0.6 Mitchison 1961 time, min time, min
Mixtures of changes in shape 4.2.4a Lichen Rhizocarpon V1- iso- V0-morph
Dynamic mixtures of V0- & V1-morphs Respiration: assim + maint + growth Assim, maint mass Growth in diam time at constant food V0-morph V1-morph
33 33 33 33 33 16 16 16 16 16 0.5 cm/yr 0.5 cm/yr 0.5 cm/yr 0.5 cm/yr 0.5 cm/yr 5 5 5 5 5 2 2 2 2 2 Dynamic mixtures of V0- & V1-morphs Celleporella 15 cm/yr White at al 2011 Am. Nat., to appear
33 16 0.5 cm/yr 5 2 Dynamic mixtures of V0- & V1-morphs Celleporella 33, 24 cm/yr White at al 2011 Am. Nat., to appear
add_my_pet Collection of data, DEB-parameters, properties: Species.xls http://www.bio.vu.nl/thb/deb/deblab/ 3 files per species, 68 species at 2011/09/29 mydata_my_pet real & pseudo-data, par-estimation, prediction-presentation, FIT predict_my_pet computes predictions given parameters pars_my_pet presents >100 implied properties Uses DEBtool (Matlab, Octave): add_my_pet.pdf (> 1000 functions & scripts) Lika et al 2011 J. Sea Res. to appear
Add_my_pet: Phyton_regius 2.8i weight, g time since birth, d Data by Bart Laarhoven
Allocation to soma 10.5.2 pop growth rate, d-1 max reprod rate, #d-1 survivor function κ κ κ Frequency distribution of κ among species in the add_my_pet collection: Median κ = 0.8, but optimum is κ = 0.5 Lika et al 2011 J. Sea Res,to appear
DEB tele course 2013 http://www.bio.vu.nl/thb/deb/ Free of financial costs; some 200 h effort investment Program for 2013: Feb 1 wk pre-course in tele-mode Feb/Mar 5 wk general theory in tele-mode April 15-23 course at NIOZ (Texel, NL) April 24-26 symposium at NIOZ (Texel, NL) Target audience: PhD students We encourage participation in groups who organize local meetings weekly Software package DEBtool for Octave/ Matlab freely downloadable Slides of this presentation are downloadable from http://www.bio.vu.nl/thb/users/bas/lectures/ Cambridge Univ Press 2009 Audience: thank you for your attention Lucas Molleman thank you for the invitation