Download
1 / 18
180 likes | 202 Views
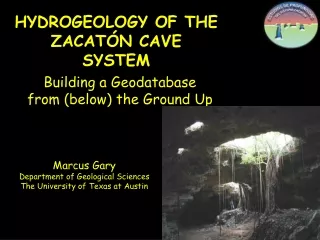
HYDROGEOLOGY OF THE ZACATÓN CAVE SYSTEM. Building a Geodatabase from (below) the Ground Up. Marcus Gary Department of Geological Sciences The University of Texas at Austin. About the Caves. The cenote Zacatón is the largest flooded sinkhole (cenote) in the world. Hydrothermal Karst System.

E N D
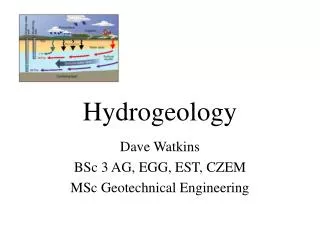
HYDROGEOLOGY OF THE ZACATÓN CAVE SYSTEM Building a Geodatabase from (below) the Ground Up Marcus Gary Department of Geological Sciences The University of Texas at Austin
About the Caves • The cenote Zacatón is the largest flooded sinkhole (cenote) in the world. • Hydrothermal Karst System Some of the Research Goals at the Zacatón System • Interpret the geological history that formed the caves • Create a 3-D geodatabase
Collect lots of field data and put all the information into true 3-dimensional context Rock Samples Biological Samples Water Samples 3-D Imaging using LADAR
What is LADAR? LAser Detection And Ranging or LAser raDAR Similar to LIDAR, but a bit different Light Intensity Distance And Ranging LIDAR LADAR • Uses laser scanner • Moving platform • “Downlooking” only • Centimeter accuracy • Uses laser scanner • Static platform • Full range of “vision” • Millimeter accuracy
LADAR Instrument Pan-Tilt Scanner: Riegl LMS-25 • Frame Rate: 90 min / frame • Range: 150 m • Accuracy: 20 mm • Approx. 6,000,000 points/frame • FOV +90 / -45 degrees
LADAR output: what you get • Reflectance Intensity (greyscale, typ. 0-255) • Range Data • raw data typ. Angle, Angle, Distance • Plots of range data are known as “Point Clouds” • Plots can be 3D or 2D (e.g. a JPEG image in which x & y spacing represents pitch and yaw angular increment and color represents scaled range) • Spectral Data (optional – RGB intensity) • NOTE** A single LADAR data frame represents a “2-1/2 D” view of the world
1. Drill and set benchmark A Total Station survey instrument was used to precisely georeference benchmarks that are the origin of each LADAR scan. 2. Shoot survey with Total Station 3. Record distance and angles and process data (easting, northing, elevation)
Lots of Benchmarks were surveyed LADAR scanning benchmark Water Level benchmark Intermediate benchmark
Color Depth Map of Range Image of Cave Cueva Cuarteles, Rancho la Azufrosa, Tamps., Mexico 1,500,000 3D data points
Some problems occur when processing TINs from LADAR data (mesh from origin, not in Z-direction) LADAR can even image a person TIN man Intensity Image
Data Processing • Lots of data – need REALLY BIG computer • Texas Advanced Computing Center (TACC) has a 24-processor SGI Onyx2 and the 3-D visualization lab to process and view the entire dataset (and more).
Future 3-D data collection in different medians Geophysical resistivity data of rock structures between sinkholes LADAR data of the surface features (already acquired). SONAR data of the underwater voids (caves)