Download

1 / 0
0 likes | 111 Views
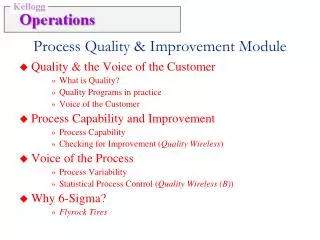
Explore the Targeting Improvement Module to optimize key operational metrics including Time, Inventory, and Throughput rate. Learn how to link these metrics to financial performance and discover improvement levers at both firm and divisional levels. Case study: MBPF Inc. Mkt-Ops at CRU Computer Rentals.

E N D