Download
1 / 16
160 likes | 177 Views
This article discusses the importance of ocean observations in fully coupled climate models, their limitations, and the need for validation. It highlights the impacts of Indian Ocean surface warming trend and the implications for Pacific, North Atlantic, and Southern Oceans. The article emphasizes the significance of accurate data assimilation and the role of ocean observations in improving climate predictions.

E N D
The value of ocean observations on coupled climate models Tamaryn Morris South African Weather Service tamaryn.morris@weathersa.co.za
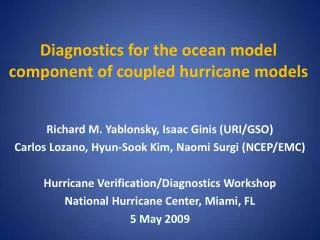
Fully coupled climate model(very few models globally in fully coupled mode) ATMOSPHERE LAND COUPLER SEA ICE OCEANS • Used to understand present day climate • Hindcast recent past climates and back in to paleoclimate scenarios • Forecast the statistical state of future climates given a particular set of conditions
Fully coupled climate model - validation(Focus on met-ocean models) ATMOSPHERE {LAND} COUPLER SEA ICE OCEANS • Good Observations and agreement with models!!! • Rely on satellites which can give vertical structure of atmosphere, stratosphere and troposphere • Daily synops and weather balloons • Some limitations in terms of cloud density and precipitation…
Fully coupled climate model - validation(Focus on met-ocean models) ATMOSPHERE {LAND} COUPLER SEA ICE OCEANS • Limited Observations, not always in agreement with models! • Most well observed and best agreement is for SST • Very limited agreement in the vertical subsurface (though improving with assimilations of data)
Fully coupled climate model - validation(Focus on met-ocean models) ATMOSPHERE {LAND} COUPLER SEA ICE OCEANS • Very Limited Observations! • Sea ice models in their infancy still compared to Atmospheric and some Ocean Models
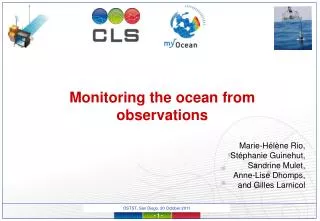
But if we have the atmospherics correct, do we need the ocean and sea-ice to be validated against observations? If we take the Indian Ocean as an example: It is the world’s smallest ocean Yet, has 22 countries bordering it, And accounts for nearly 1/3 of global population With many low-lying regions and island-states
But if we have the atmospherics correct, do we need the ocean and sea-ice to be validated against observations? If we take the Indian Ocean as an example: It is the world’s smallest ocean Yet, has 22 countries bordering it, And accounts for nearly 1/3 of global population (poor and marginal) With many low-lying regions and island-states Projected 340 million people exposed to coastal hazards by 2030
Madden-Julian Oscillation, Indian Ocean Dipole and Indian Ocean Basin Mode Influences Resultant decrease in rainfall over east Africa Cyclogensis Increased heat Cyclogensis Impact SA Rainfall Sub-tropical Indian Ocean Dipole and Ningaloo Nino Influences Formation of Madden-Julian Oscillation Global oceanic uptake of anthropogenic CO2 ⅕ Where does the heat go? Fastest warming ocean MJO
Implications to the Indian Ocean region • Far reaching impacts from Indian Ocean surface warming trend: • Influencing Pacific and North Atlantic Climate • Droughts in West Sahel and Mediterranean • State-of-the-art models not reproducing ocean processes correctly, causing adverse predictions of monsoons • Due to decrease in rainfall over east African, predicted increase in under-nourished people in east Africa region by 50 % by 2030 • What else could happen? • Will there be an increase of cyclones in the Indian Ocean? • Will there be an increase in frequency of storm surges in the Indian Ocean? • Where does all that excess heat go? West? South? • And this is just for the Indian Ocean. What of Atlantic, Pacific • and Southern Oceans???
Intense Tropical Cyclone Idai– Mozambique Deadliest for 2019 worldwide! Record-breaking seventh intense tropical cyclone for 2018/2019 SWIO cyclone season!
Impact of Argo floats alone on the Indian Ocean region (profiling from 2000 m to the surface)
Impact of Argo floats alone on the Indian Ocean region (profiling from 2000 m to the surface) Argo floats (18 years) Only 18.5 % of profiles globally!! Subsurface measurements (100 years)
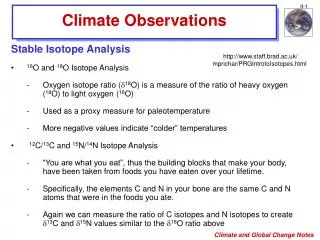
Impact of Argo floats in terms of global measurements and instrumentation Annualnumberoftemperature profilesbyinstrumenttype Around 80 % of climate quality subsurface temperature casts are coming from Argo and being assimilated in to ocean hydrodynamic models. CTD XBT MBT Argo bottle Argo
Global surface observations as of January 2019 (Surface tracked drifters, surface expression moored buoys, Ship Observation Team vessels of opportunity – link between met and ocean)
So what can we as SAWS do? • Stay current, stay involved with ocean observation programs (get MORE involved), contribute knowledge, assist with deployments where possible, procure new instruments • Ice-observation buoys in the Marginal Ice Zone, Southern Ocean • Become knowledgeable with data assimilation techniques in to ocean numerical models • Validate! Validate! Validate! • Integrate these data in to climate coupled models