Correlations of Biomarkers with Clinical Parameters in MS and Clinically Isolated Syndrome
10 likes | 139 Views
This study investigates the relationships between various biomarkers and clinical as well as paraclinical parameters in patients with Multiple Sclerosis (MS) and Clinically Isolated Syndrome (CIS). The provided graphs illustrate raw data correlations, including Spearman’s correlation coefficients adjusted for age. Notable findings include correlations between NAA and age, NfH and age, and several tau level interactions. These insights may enhance understanding of disease progression and help tailor patient management strategies.

Correlations of Biomarkers with Clinical Parameters in MS and Clinically Isolated Syndrome
E N D
Presentation Transcript
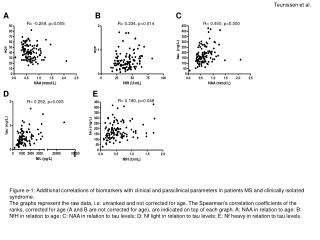
Teunissen et al. A B C R= -0.259, p<0.005 R= 0.234, p<0.014 R= 0.450, p<0.000 D E R= 0.180, p<0.048 R= 0.252, p<0.005 I Figure e-1: Additional correlations of biomarkers with clinical and paraclinical parameters in patients MS and clinically isolated syndrome. The graphs represent the raw data, i.e. unranked and not corrected for age. The Spearman’s correlation coefficients of the ranks, corrected for age (A and B are not corrected for age), are indicated on top of each graph. A: NAA in relation to age: B: NfH in relation to age; C: NAA in relation to tau levels; D: Nf light in relation to tau levels; E: Nf heavy in relation to tau levels.